EUR/CHF Short — EUR Risk vs CHF Carry Unwind: Macro FX Analysis
Original analysis
English edition of the original analysis by trademvment. Original TradingView publication ↗
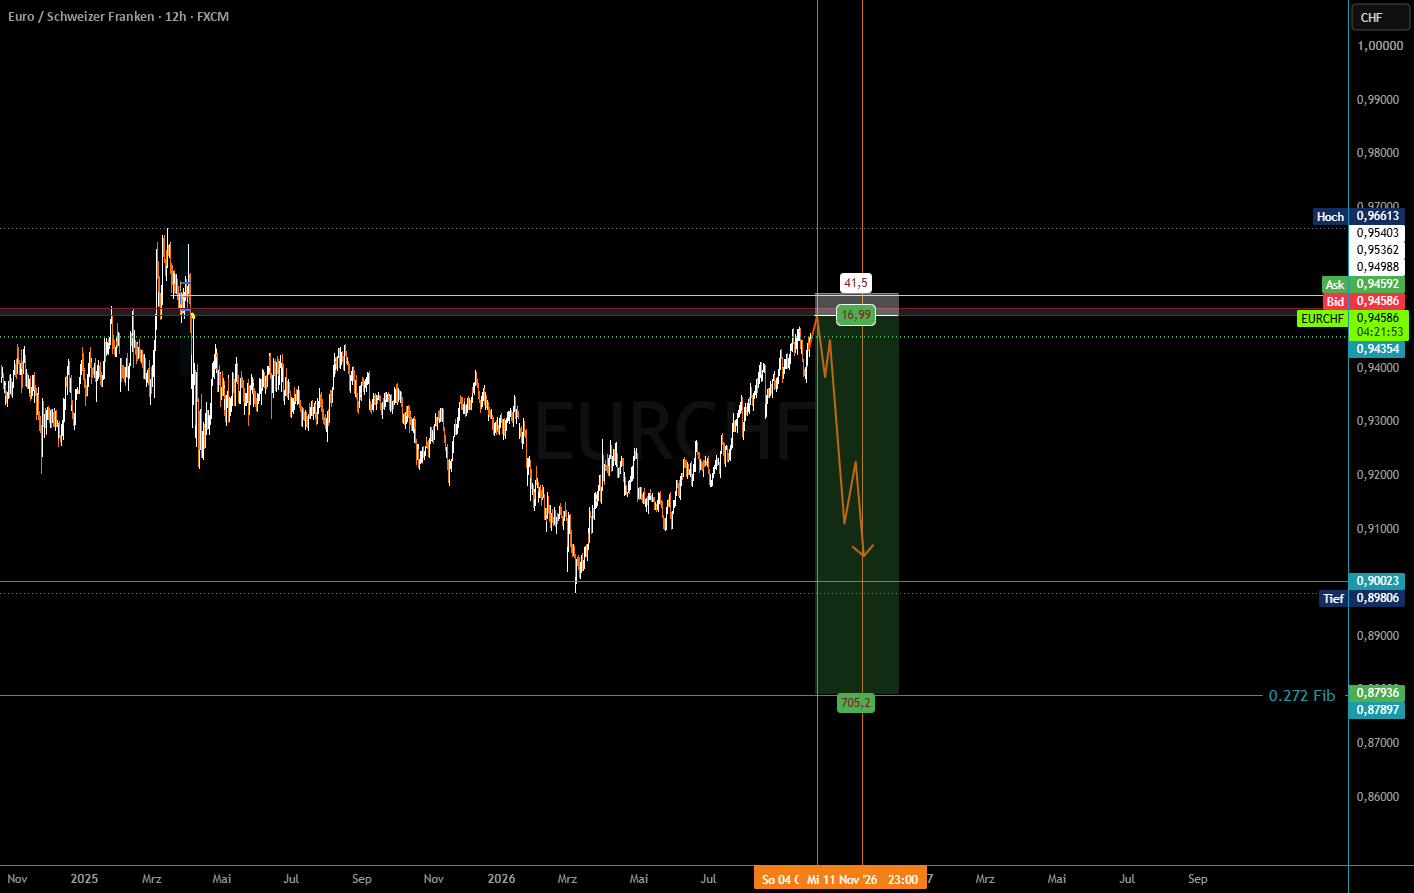
My thesis: Not just a weaker euro, but a potentially suddenly stronger franc.
I am preparing conceptually for a EUR/CHF short over the fourth quarter of 2026. My timing focus extends into the first to second week of January 2027. I am particularly interested in the window between 5 and 13 October as a possible starting point for a short-term trend reversal in the franc.
The idea combines euro positioning, seasonality and European growth risks with a second consideration: If the Swiss franc is increasingly used as a funding currency for carry trades, subsequent risk aversion could trigger additional CHF buying to close those positions.
This is a conditional macro scenario, not a certain forecast. In particular, the assumed shift of carry funding from the yen to the franc is a hypothesis, not a capital movement demonstrated by my charts.
1. Euro: The COT structure reminds me of 2023–2025
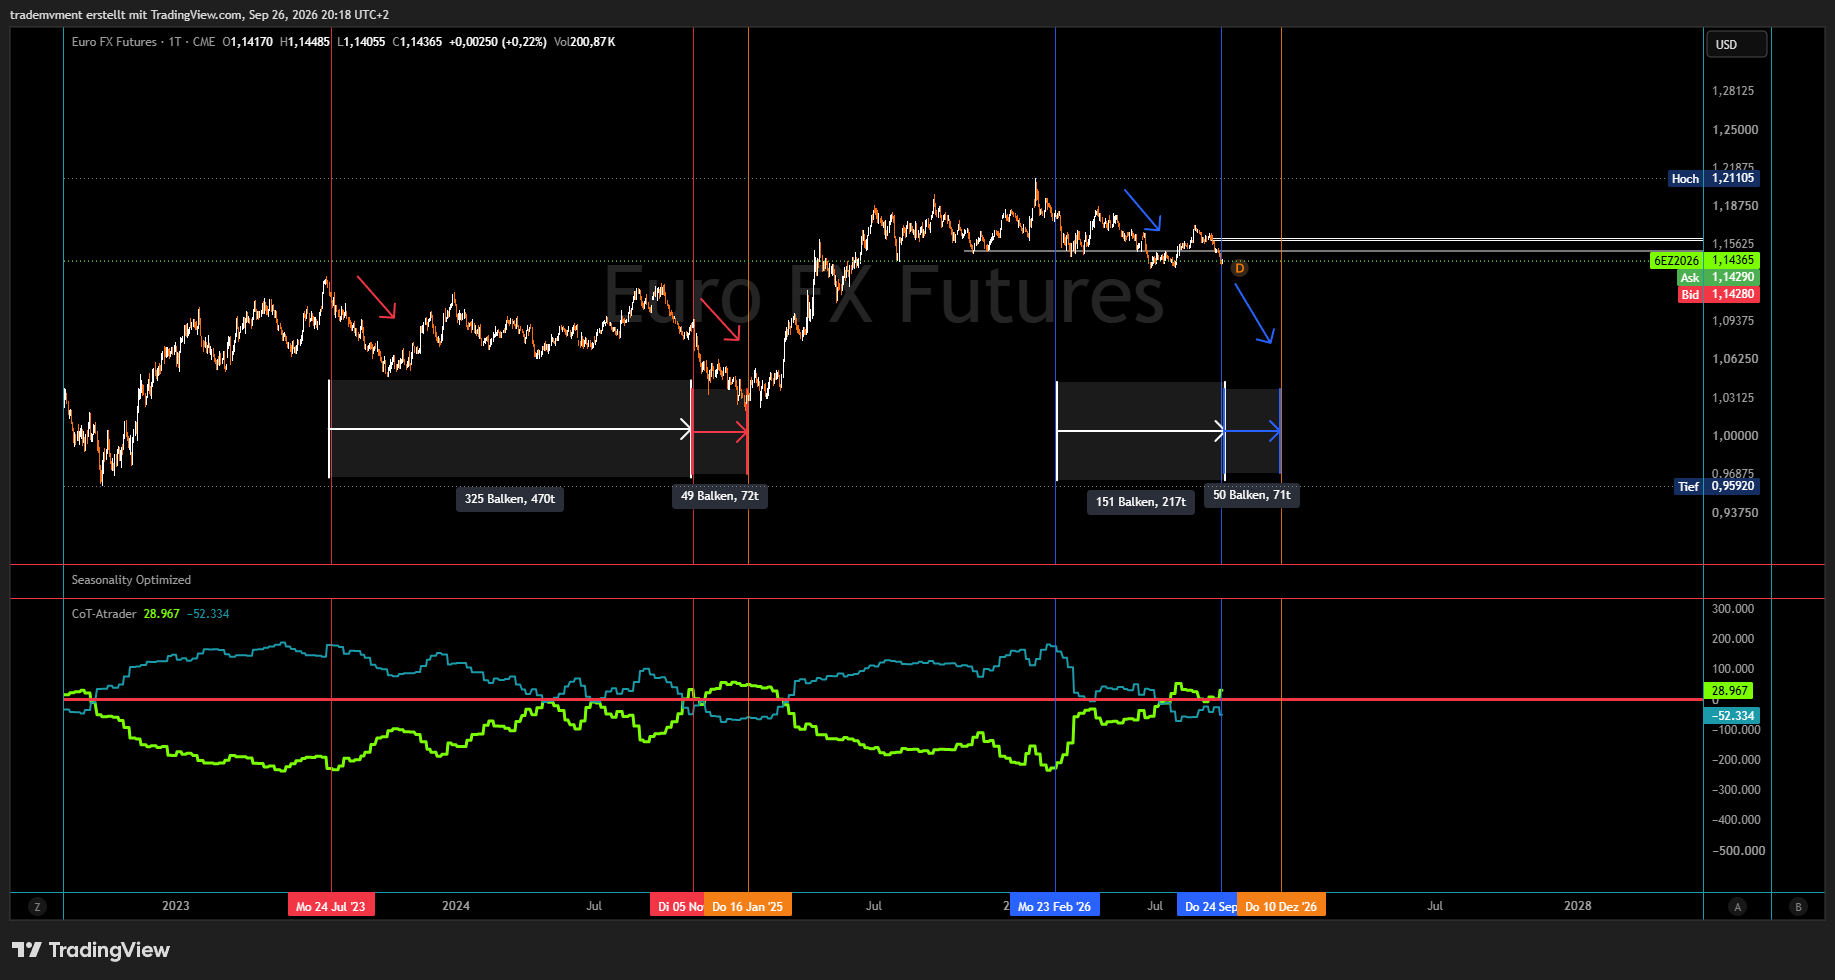
My starting point is the euro future and its positioning in the Commitments of Traders report.
In the comparison period beginning in July 2023, Commercial net positioning changed over a long phase while price initially remained predominantly within a broad trading range. The marked accumulation phase covers around 470 calendar days. Later, the upper area of that range was tested again before the euro fell sharply.
The subsequent decline continued until January 2025, even though Commercials had already shifted their net positioning further towards long. Accumulation by hedgers does not prevent further price declines and does not, by itself, provide a reliable turning-point signal.
Since February 2026, I see a similar but more compressed configuration. In the chart, the marked positioning shift covers around 217 days rather than around 470 days. At the same time, the lower part of the previous consolidation is under pressure.
If the break of the trading range is confirmed, the next downward impulse could develop more quickly. However, I do not infer either an inevitably larger move or an exactly reproducible timetable from the shorter accumulation phase.
The analogy is a clue for a scenario, not a one-to-one repetition.
Commercials predominantly reflect hedging activity. Their positioning should not be equated with the direction of a speculative conviction position.
2. Euro seasonality: An additional argument for the fourth quarter
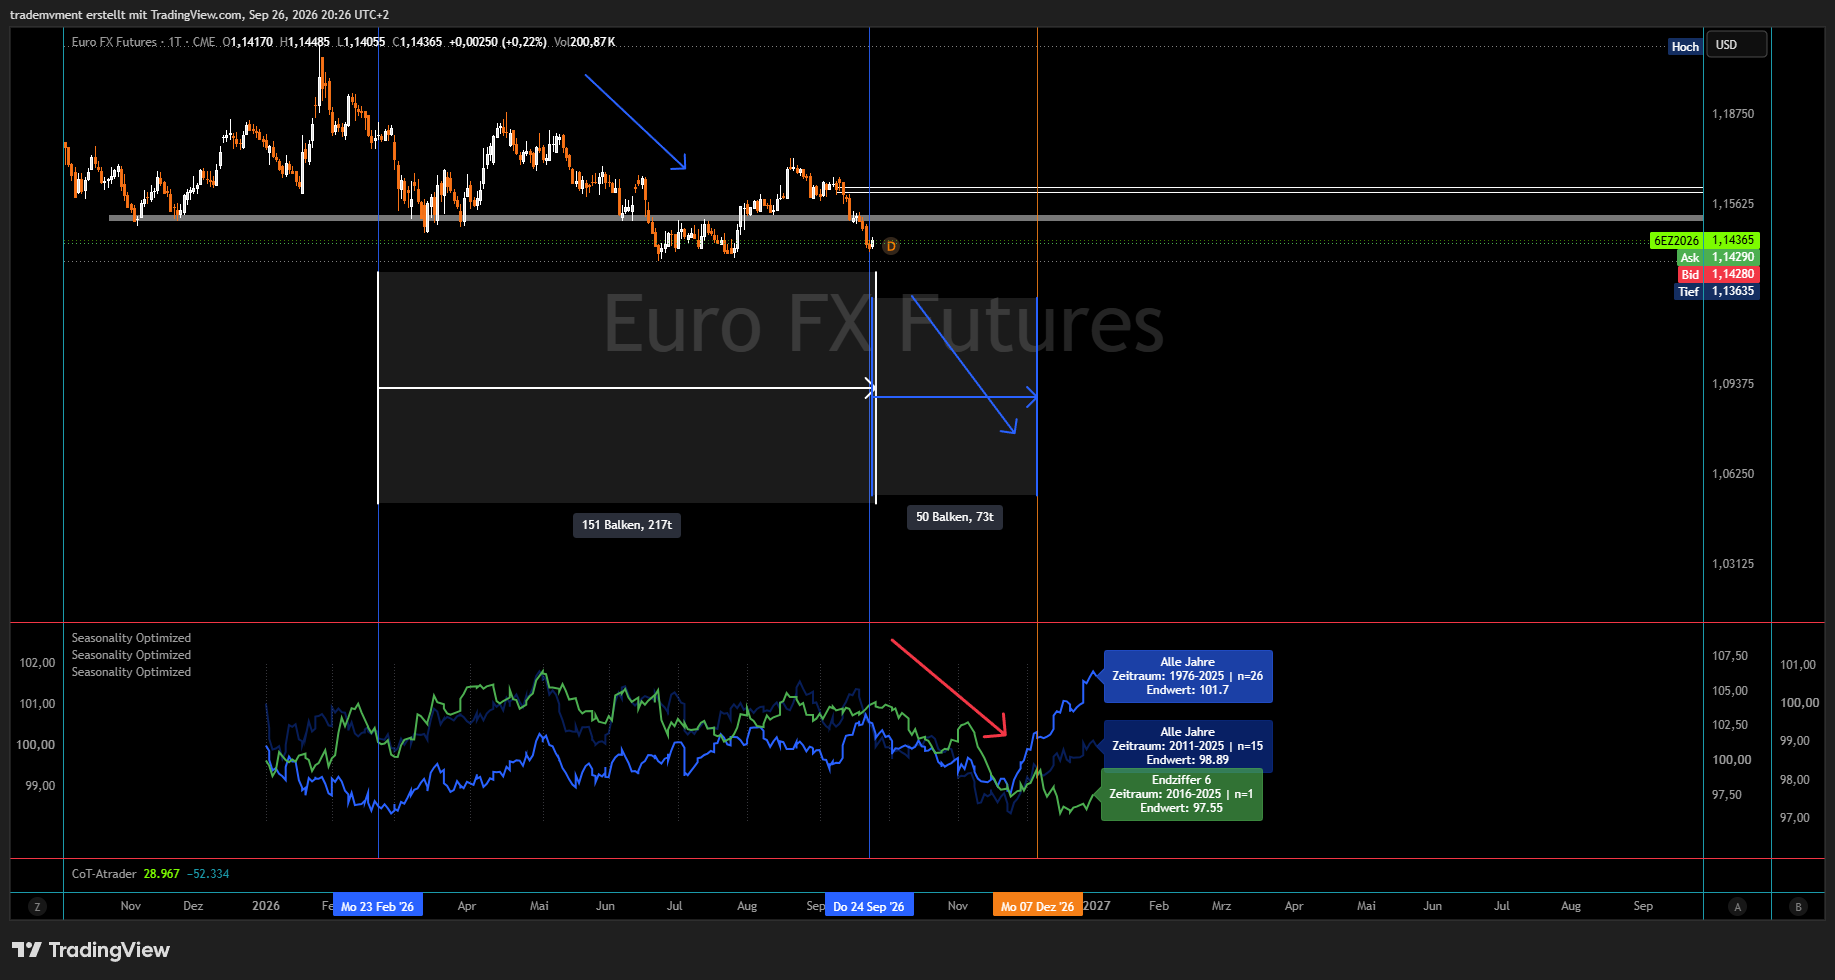
In my seasonal comparison series, a weaker period stands out from late September through October and November, and in some cases into December.
This pattern supports my timing for the euro side. However, it replaces neither a fundamental catalyst nor price confirmation. The series shown also differ in their selection and paths.
3. Euro macro: Initial warning signals, but no broad-based collapse yet
Original euro-area dashboard attachment: Imgur album. The image could not be verified during the 17 October 2026 source review.
In the PMIs shown there, the Manufacturing reading of 52.7 is slightly below the expected 52.8 but above the previous 51.9. This number alone does not indicate a shrinking industrial sector. The Services PMI is slightly weaker at 51.6 after 51.7, but is also above 50.
The warning signal is clearer in retail sales: −0.6 versus an expected +0.3 and a previous +0.2. Reported consumer confidence, by contrast, matches consensus at −15.5 and improves slightly from −15.9. “Neutral” here describes the surprise relative to the forecast, not neutral consumer sentiment.
In the labour market, the reported unemployment rate of 6.4% is above the expected 6.3%, but not above the previous reading, also 6.4%. Wage growth of 3.0% is weaker than expected and previously. To me, these are only warning signals..
The stronger-than-expected GDP growth in the dashboard and the higher trade surplus argue against a uniformly negative portrayal. However, I view this somewhat differently from how it is often presented. These are subjective points and will not be included here.
For industrial production, the release date also matters: The older positive dashboard figure has since been supplemented by Eurostat's release of 16 September. It reports a monthly decline of 0.1% for July.
Source: ec.europa.eu/eurostat/web/products-euro-indicators/w/4-16092026-ap
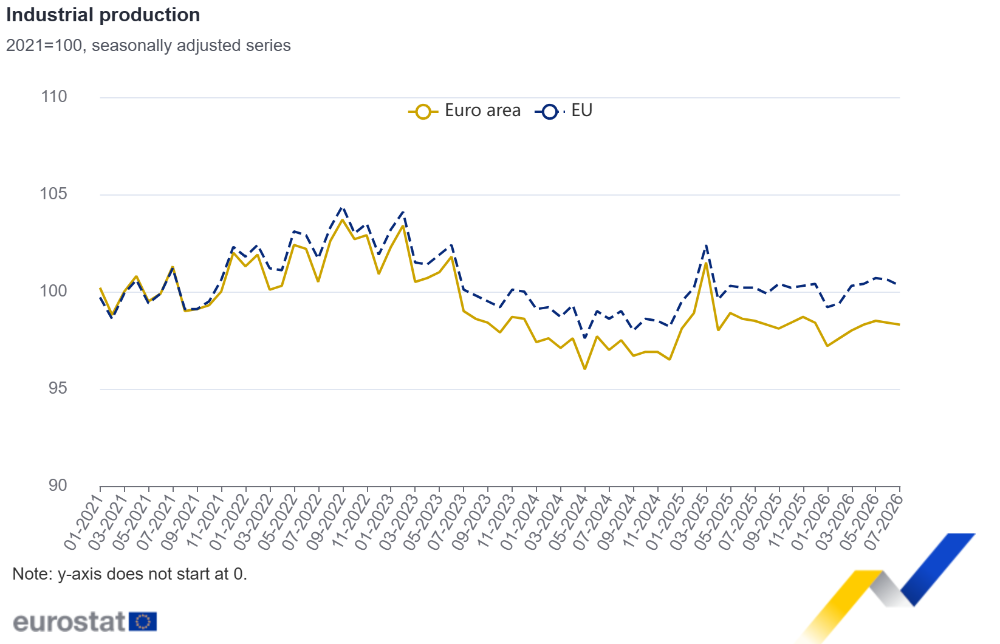
My short is therefore not based on “all the data are already collapsing”, but on the risk that individual signs of weakness develop into a broader demand problem. Therefore, they will all break. (Subjectively, of course.)
Inflation also requires a distinction: Headline inflation rose from 2.9% to 3.2% in August. The fact that 3.2% is below a consensus estimate of 3.3% does not make this declining inflation. The core rate, by contrast, fell from 2.5% to 2.4%. Elevated producer prices in the dashboard also argue against a blanket all-clear on cost pressure.
Source: ec.europa.eu/eurostat/web/products-euro-indicators/w/2-17092026-ap
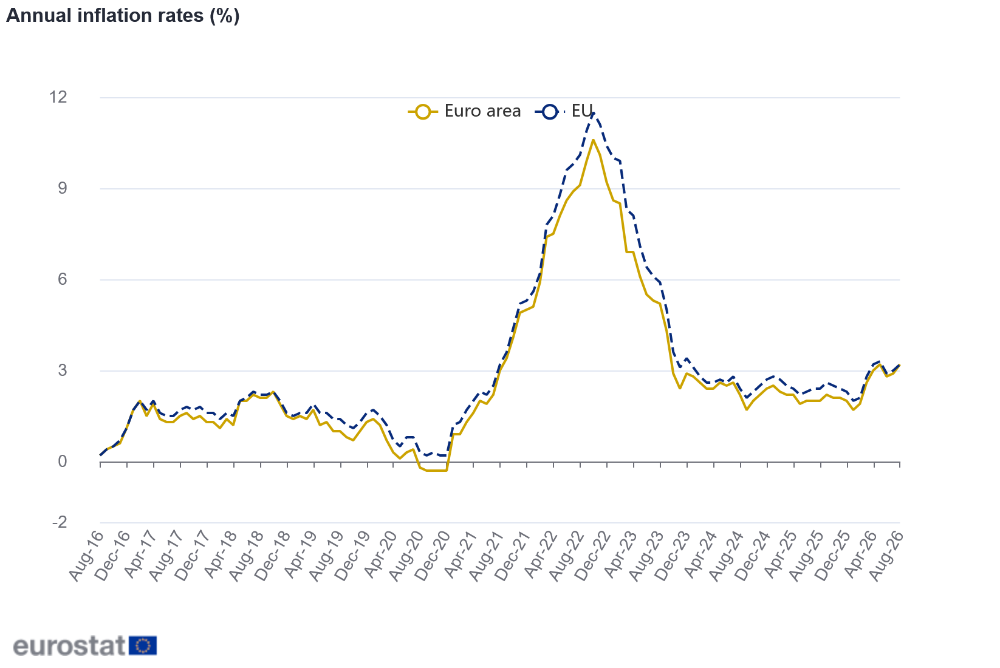
For Q1–Q2 2027, I consider stronger demand-side disinflation possible. By this I mean easing price pressure due to weaker consumption and lower economic activity, rather than “demand destruction in a currency”. That would also be too subjective.
4. Energy, food and financing: My European risk scenario
My central idea is a possible overlap: High energy and financing costs meet an economy whose resilience could weaken later on.
On 10 September, the ECB raised its three policy rates by 25 basis points. Since 16 September, the deposit rate has been 2.50% and the main refinancing rate 2.65%. The 2.65% in the dashboard is therefore not the deposit rate.
The ECB sees upside risks to inflation and downside risks to growth. However, its baseline projection is not a recession: It expects growth of 0.9% for 2026 and 1.4% for 2027. My more negative scenario is explicitly below this baseline.
Source: ecb.europa.eu/press/pr/date/2026/html/ecb.mp260910~314e508016.en.html
With gas, I am concerned with vulnerability and periods of power, not an already established shortage.
Germany's Federal Network Agency describes German storage levels as significantly lower than in comparable periods of previous years. At the same time, it assesses current supply as stable and the risk of strained gas supply as still low. Alongside storage, pipeline imports, LNG, infrastructure and consumption are crucial.
Source: bundesnetzagentur.de/DE/Gasversorgung/aktuelle_gasversorgung/start.html
Live source: The gas-supply page updates over time and may no longer show the conditions at publication.
My stress scenario would become more relevant if additional pressures accompanied lower buffers: Prolonged cold spells, stronger international LNG demand or supply disruptions.
Companies and households might then have to spend more on energy while demand disappears elsewhere. Geopolitical interventions could amplify this; I do not assume deliberate intent by particular states as a fact. (That would also be very subjective.)
El Niño is an additional risk factor. The WMO expects the event to strengthen further. However, this does not automatically imply an especially cold German winter or a certain jump in wheat prices. Harvest impacts depend on the growing region, crop and timing. A British scientific assessment also identifies possible pressures on global food chains and the LNG market.
Sources: wmo.int/news/media-centre/el-nino-set-become-very-strong-raising-risks-of-extreme-weather-2027
gov.uk/government/publications/impacts-of-el-nino-on-the-uk/impacts-of-el-nino-on-the-uk
Stagflation and later disinflation are not mutually exclusive in this scenario: Initially, supply shocks could keep prices high while growth declines. Later, demand weakness could slow price pressure more strongly. How quickly this transition takes place remains open.
This is my !!!Subjective!!! risk assessment, not a statement that this sequence of events could unfold that way.
5. Why the Swiss franc? Funding today, buying pressure tomorrow
On the other side of the pair, I am interested not only in the Swiss economy but also in the franc's potential role in international financing.
The Bank of Japan raised its target rate to around 1.25% in September. The SNB, by contrast, left its policy rate at 0% on 24 September. This difference makes it interesting to ask whether the franc has become more attractive relative to the yen for certain carry strategies.
Sources: boj.or.jp/en/mopo/mpmdeci/mpr_2026/k260918a.pdf
snb.ch/en/publications/communication/press-releases-restricted/pre_20260924
The mechanism can be illustrated with a simplified example that is not fully currency-hedged: An investor borrows in CHF, sells them for USD and holds higher-yielding dollar assets. When the position is later unwound, the CHF liability must be repaid or the corresponding short exposure closed. Francs are bought back for this purpose.
If a flight to safe assets occurred at the same time, these purchases could generate additional CHF demand. The SNB itself describes the franc as a safe-haven currency.
Source: snb.ch/en/snb-explained/swiss-franc
I therefore see it as possible that CHF financing could provide an additional amplifier for subsequent appreciation.
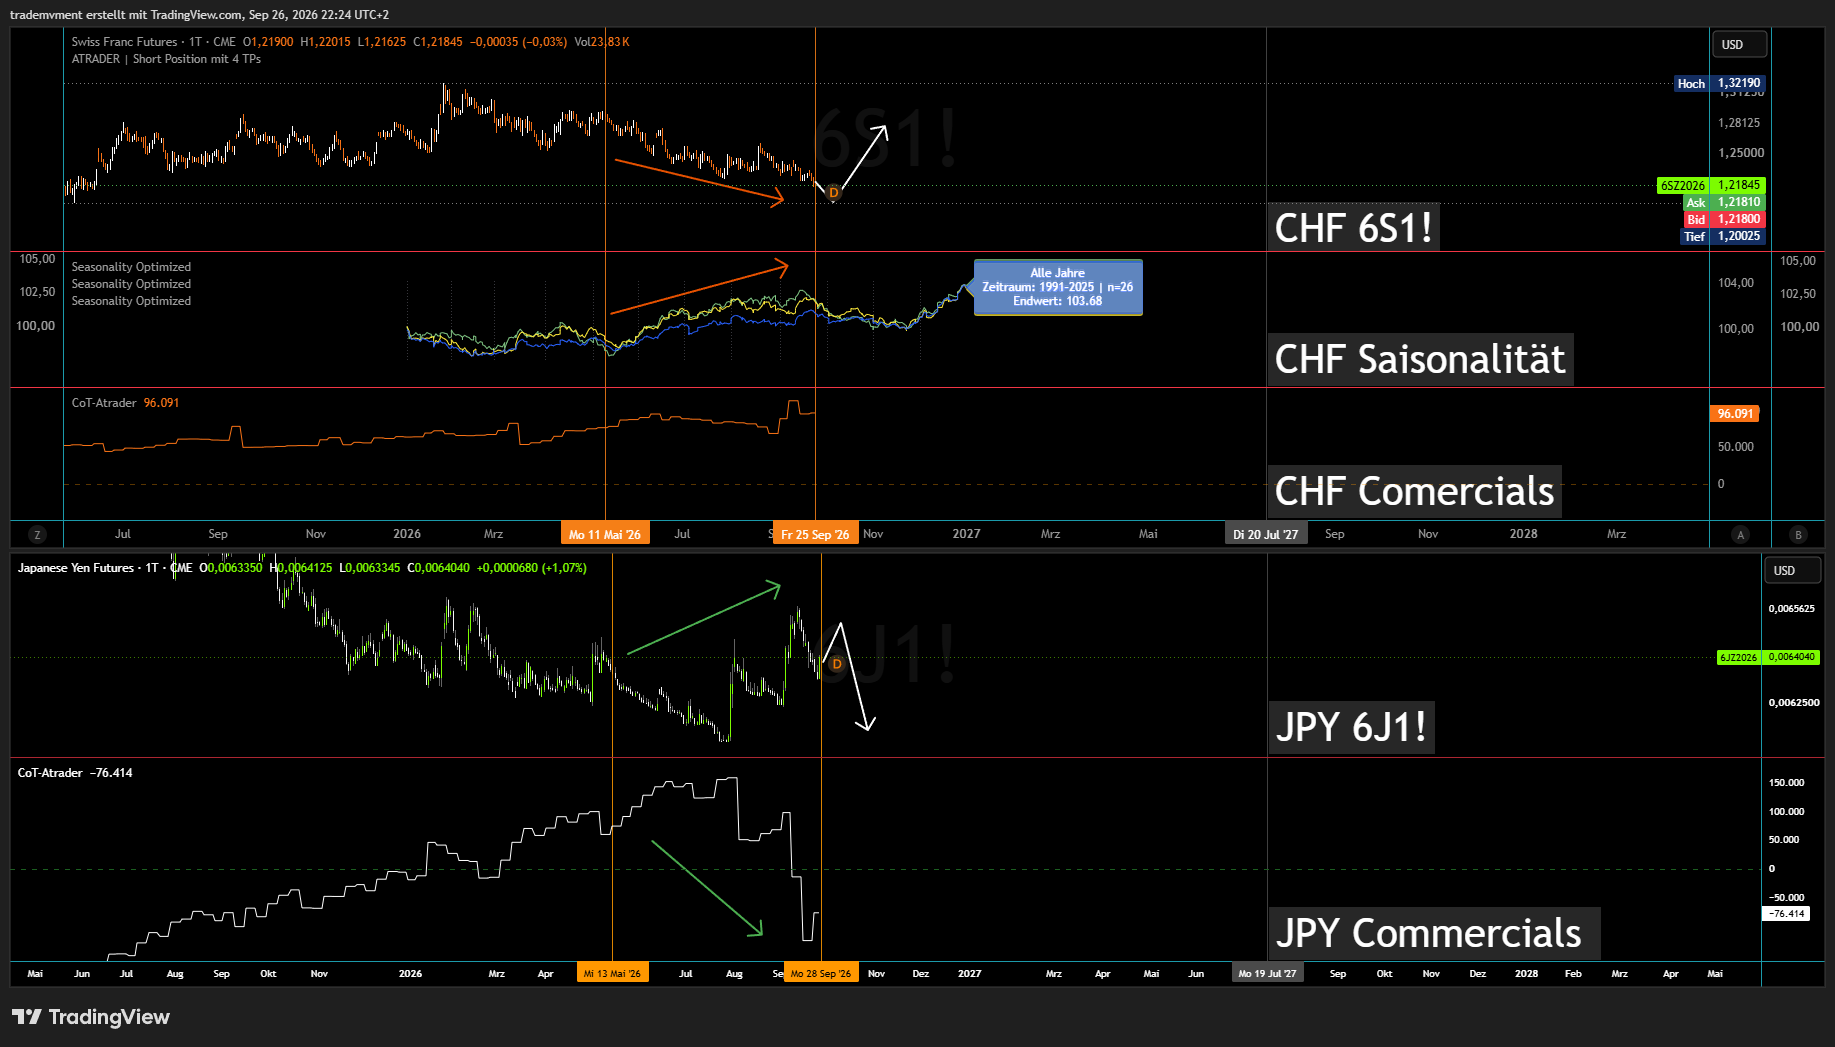
The comparison chart highlights CHF weakness relative to the seasonal patterns shown. At the same time, CHF and JPY show differing developments in Commercial positioning.
The SNB provides a consistent but non-conclusive observation: Since its June assessment, the franc lost around 3% on a trade-weighted basis. It attributes this to the wider interest rate differential relative to other currency areas. That is consistent with a carry incentive, but does not quantify a shift out of the yen.
Source: snb.ch/en/publications/communication/speeches-restricted/ref_20260924_mslanmargpe
The decline in JPY Commercial positioning alone is also not evidence of such a shift. Hedgers can reduce positions while speculative market participants buy yen. Rising Japanese rates therefore do not automatically require rising Commercial net longs.
6. CHF COT: Gross accumulation is not the same as net long
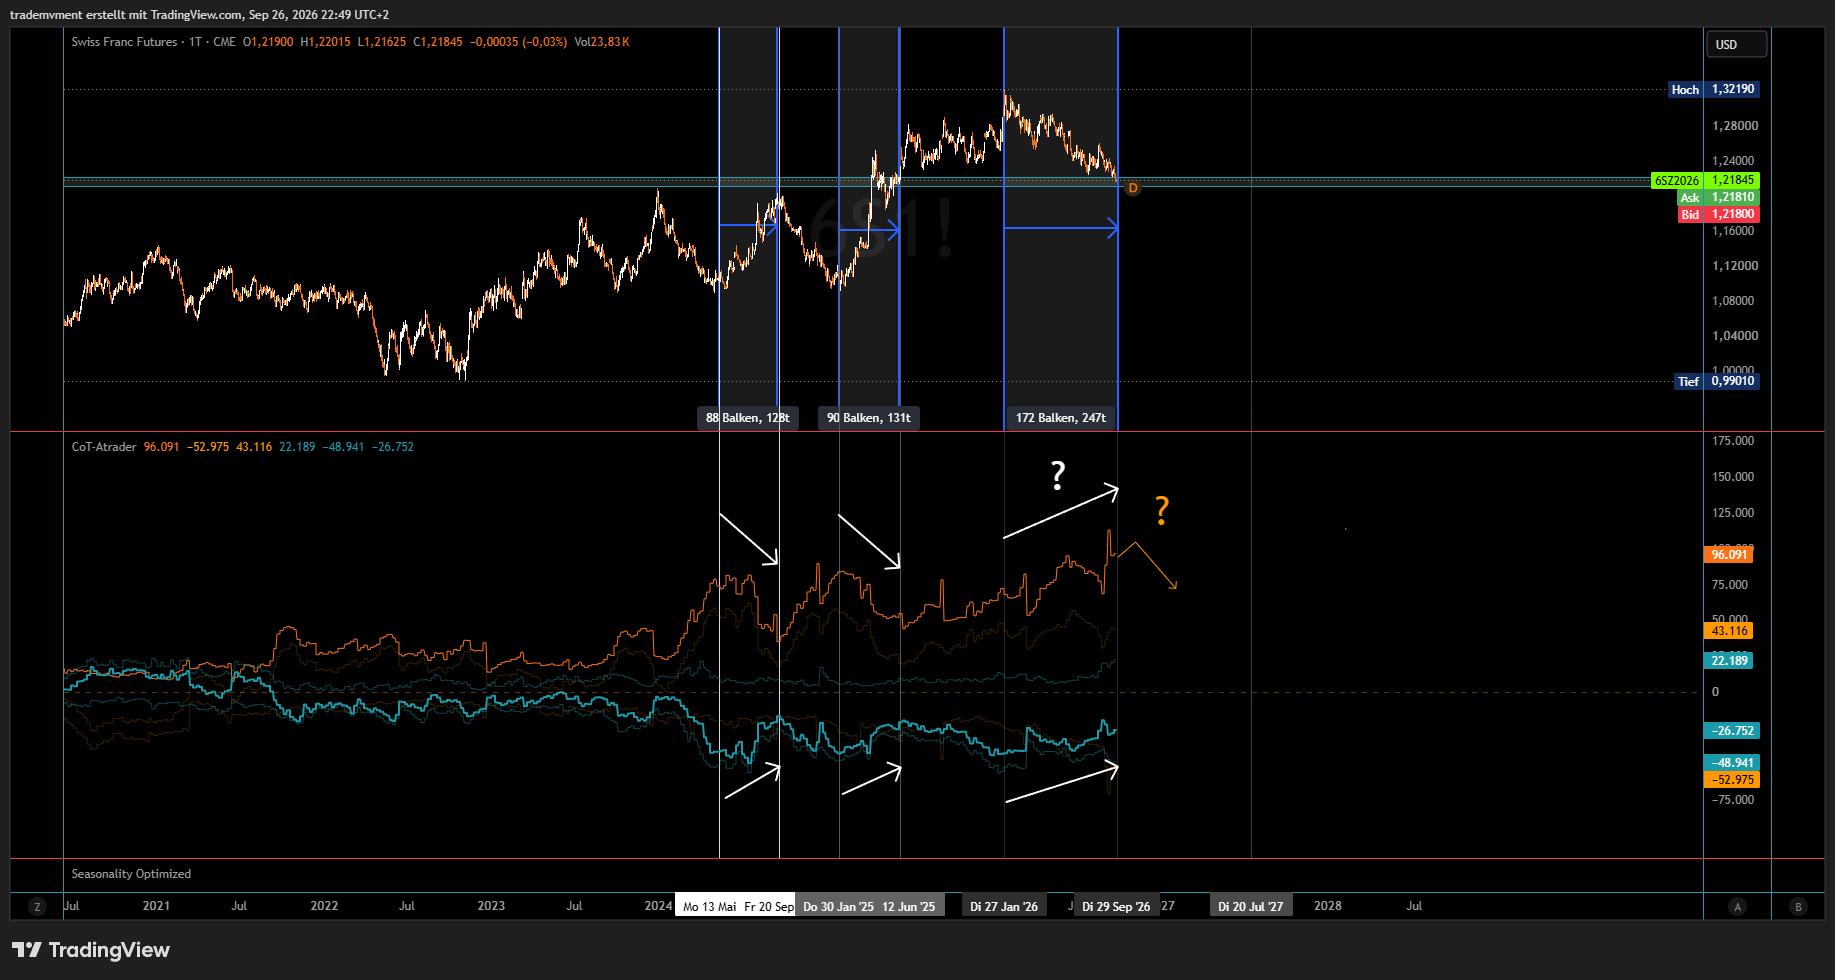
In the chart, I compare two earlier phases of roughly 130 days each with the most recent marked phase of around 247 days. The earlier periods coincided with pronounced CHF strength. In the latest period, price and individual positioning series develop differently.
The distinction between long holdings, short holdings and the net position is crucial here. According to the classification of my displayed series:
Commercials: 96,091 long contracts minus 52,975 short contracts = 43,116 contracts net long.
Non-Commercials: 22,189 long contracts minus 48,941 short contracts = 26,752 contracts net short.
The figure of 96,091 highlighted in the other CHF chart is therefore a gross long holding, not the net position. An increase in speculative long positions also does not mean Non-Commercials are net long overall.
For my carry-unwind idea, the remaining speculative net short holding is precisely what matters.
It could allow buying pressure if the trend reverses. However, this alone cannot determine whether the position is large enough, highly leveraged or actually predominantly carry-driven. An absolute holding replaces neither comparison with open interest nor context within its own history.
Furthermore, the COT figures show only a slice of the market.
7. The BIS finding: A mechanism, not confirmation of my timing
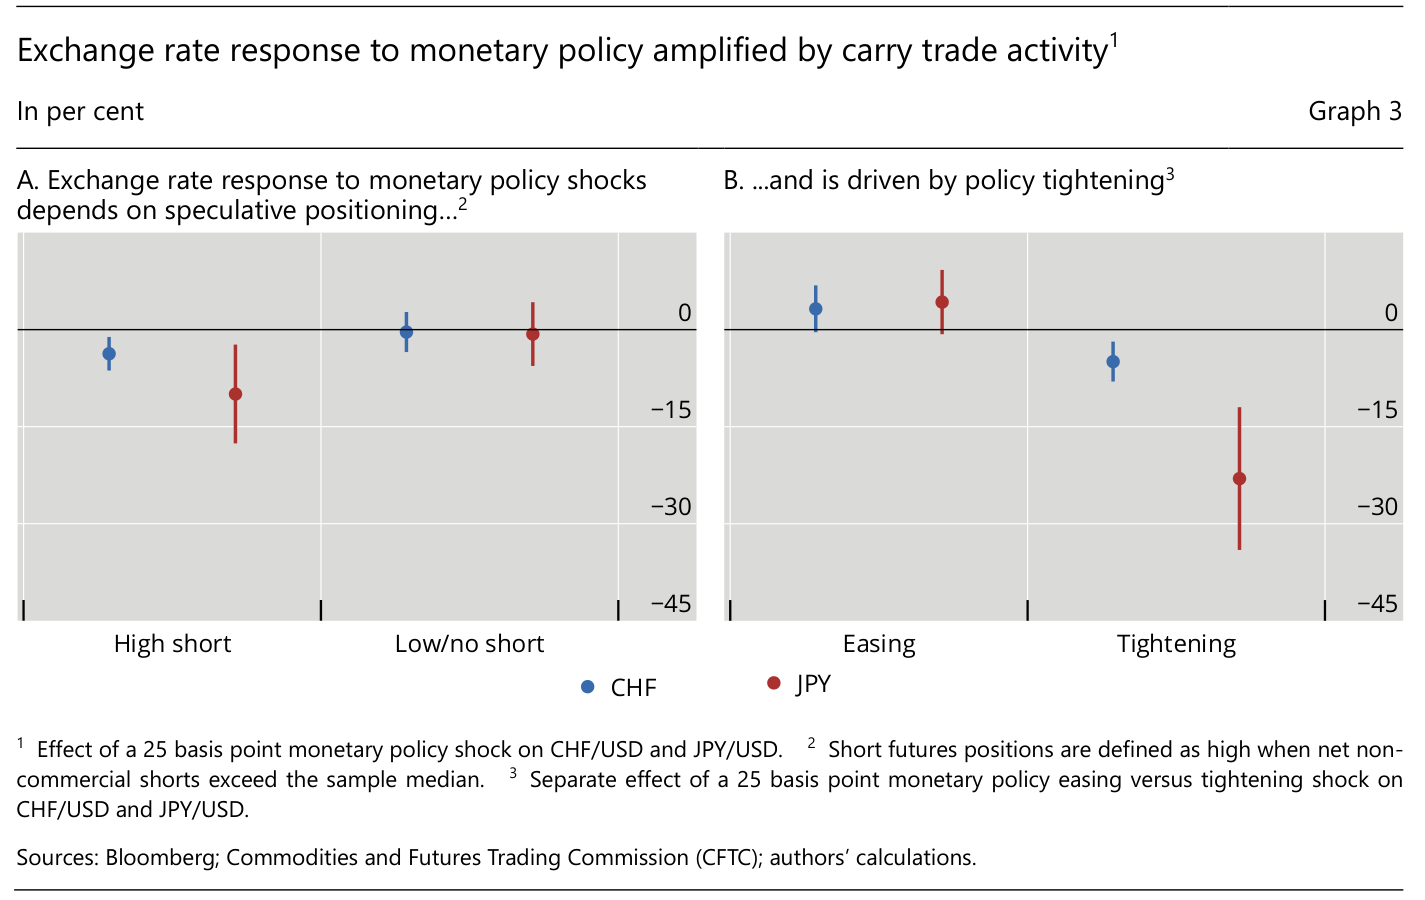
BIS Bulletin No. 124 of 6 May 2026 examines precisely how carry positioning can amplify exchange rate reactions to monetary policy surprises.
The authors find stronger appreciation responses in CHF and JPY to unexpected monetary tightening when substantial speculative short positions previously existed in these funding currencies. Closing such positions can amplify the move.
Original BIS excerpt attachment: Imgur album. The image could not be verified during the 17 October 2026 source review.
The highlighted paragraph in the attached excerpt is on printed page 2, or PDF page 4. This is a BIS Bulletin, not a Working Paper.
The study supports the possible amplification mechanism. It proves neither a current yen-to-CHF shift nor an imminent October squeeze.
It also examines monetary tightening surprises in particular. My application to a broader risk-off shock is an additional hypothesis. The SNB's current zero-rate policy is not itself the trigger for such a tightening surprise.
8. Swiss macro: Relatively resilient, but not isolated
The Swiss dashboard provides several positive surprises: Manufacturing PMI 57.1 versus an expected 53.5; retail growth 2.3 versus 1.3; industrial production 5.5 versus −4.7. Employment is also above the estimate, and the reported unemployment rate is 3.0%.
Original Swiss dashboard attachment: Imgur album. The image could not be verified during the 17 October 2026 source review.
At the same time, GDP, consumer confidence and the trade balance disappoint relative to their respective expectations. A positive overall picture therefore does not mean all Swiss data are strong. In industrial production in particular, the comparison base and individual sectors can also have a large effect.
Inflation of 0.8% is above the 0.5% expected in the dashboard. The 0.5% is consensus there, not the previous reading, which is 0.4%.
The SNB describes second-quarter growth as exceptionally strong, partly boosted by chemicals and pharmaceuticals. Even without this special effect, it says growth was solid and broad-based. At the same time, it cites below-average capacity utilisation and unemployment that had risen slightly further until early summer.
Source: snb.ch/en/publications/communication/press-releases-restricted/pre_20260924
Therefore: The franc could be relatively attractive in my European stress scenario without my needing to assume a Swiss economic boom.
The SNB remains a significant opposing risk.
It keeps foreign exchange market interventions available. However, this does not imply a blanket objective of a constantly weaker franc: Price stability and appropriate monetary conditions are decisive. How much appreciation would be tolerated or resisted depends on the environment.
In the favourable scenario, I therefore expect possible acceleration and high volatility, rather than a smooth one-way street. An SNB response also does not automatically limit an appreciation impulse to just a few days.
9. CHF seasonality: My observation window from 5 to 13 October
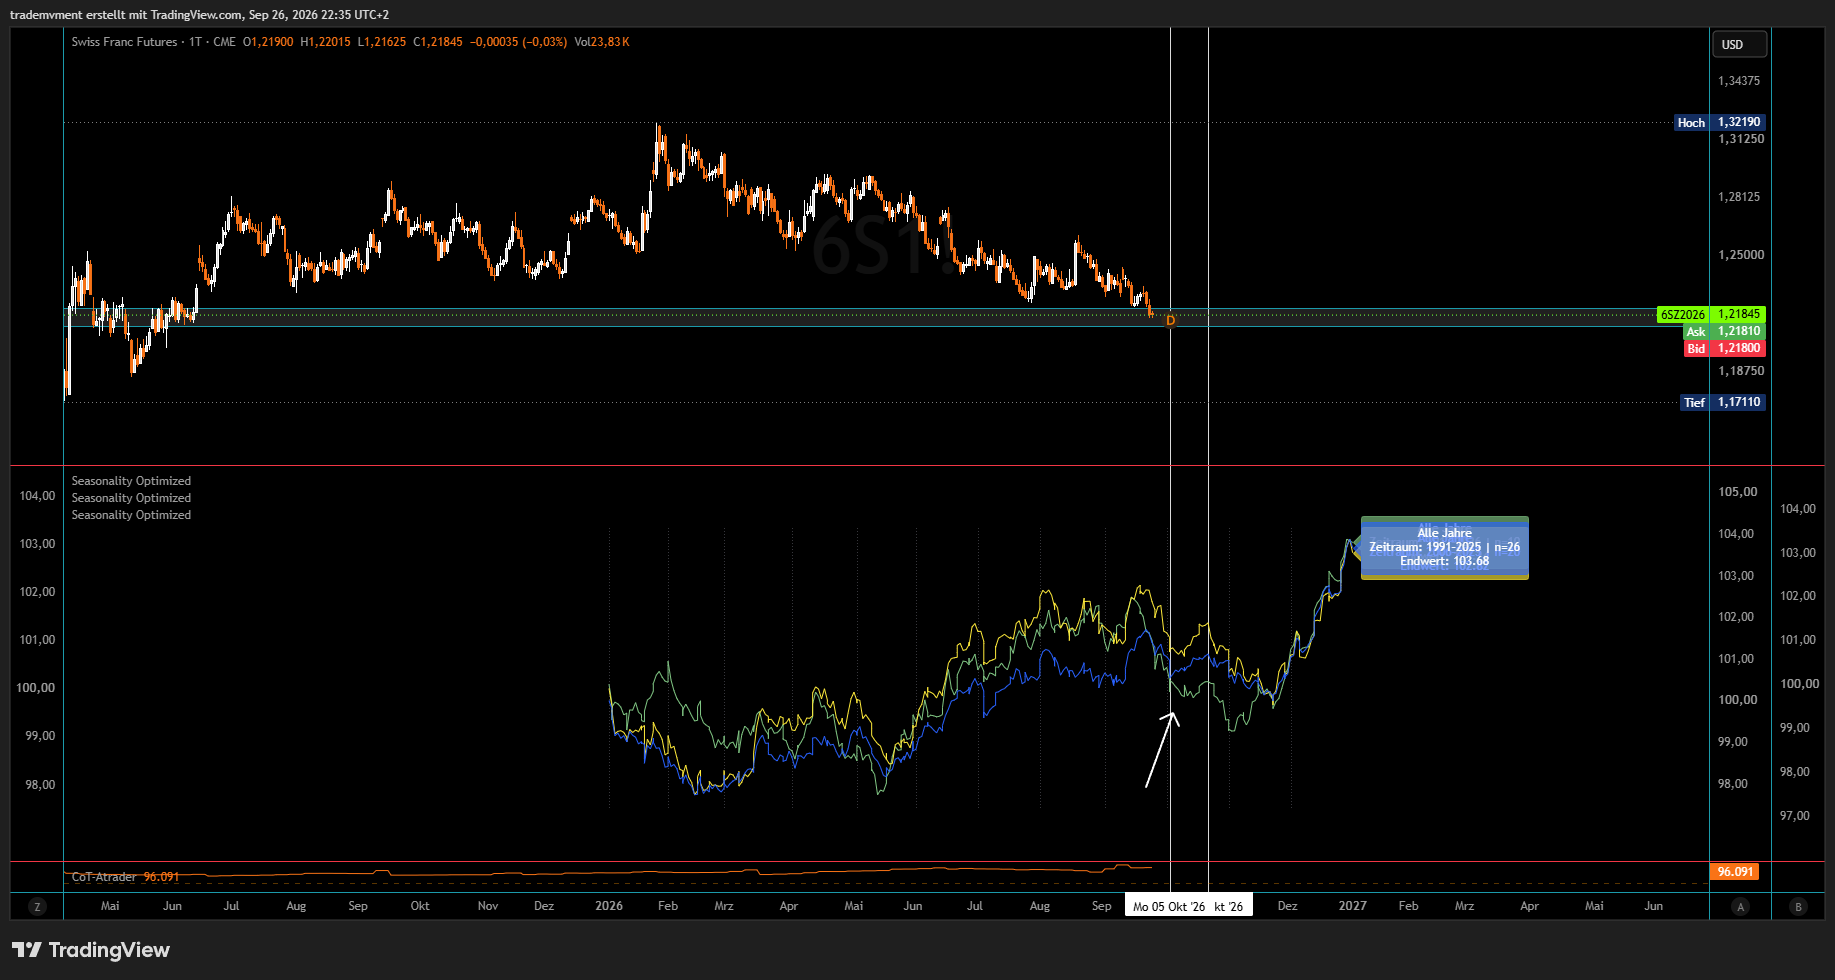
In the seasonal comparison series shown, I see a short-term turning area in early to mid-October. I am particularly watching 5 to 13 October.
Important: The lines do not subsequently show a uniformly continuous uptrend through January. I therefore use the window as a possible starting point for an impulse, not as seasonal proof of a months-long rally.
10. Historical EUR/CHF examples: Illustrations, not a crash clock
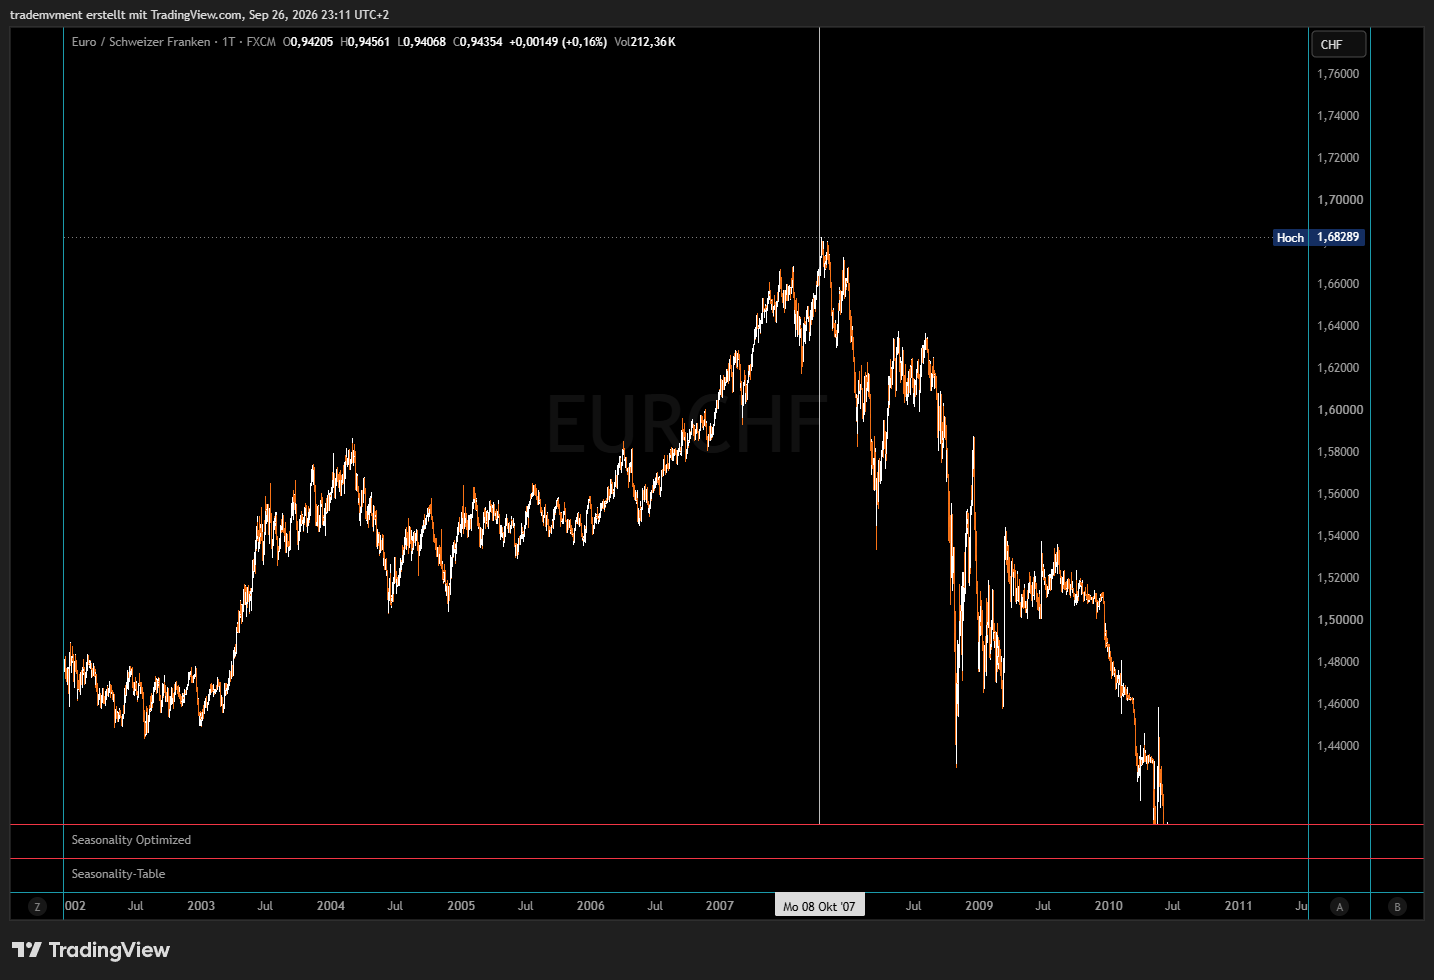
The first chart marks 8 October 2007 near a pronounced high. A substantial EUR/CHF decline subsequently developed. For me, this illustrates how far a relative repricing between the euro and franc can go.
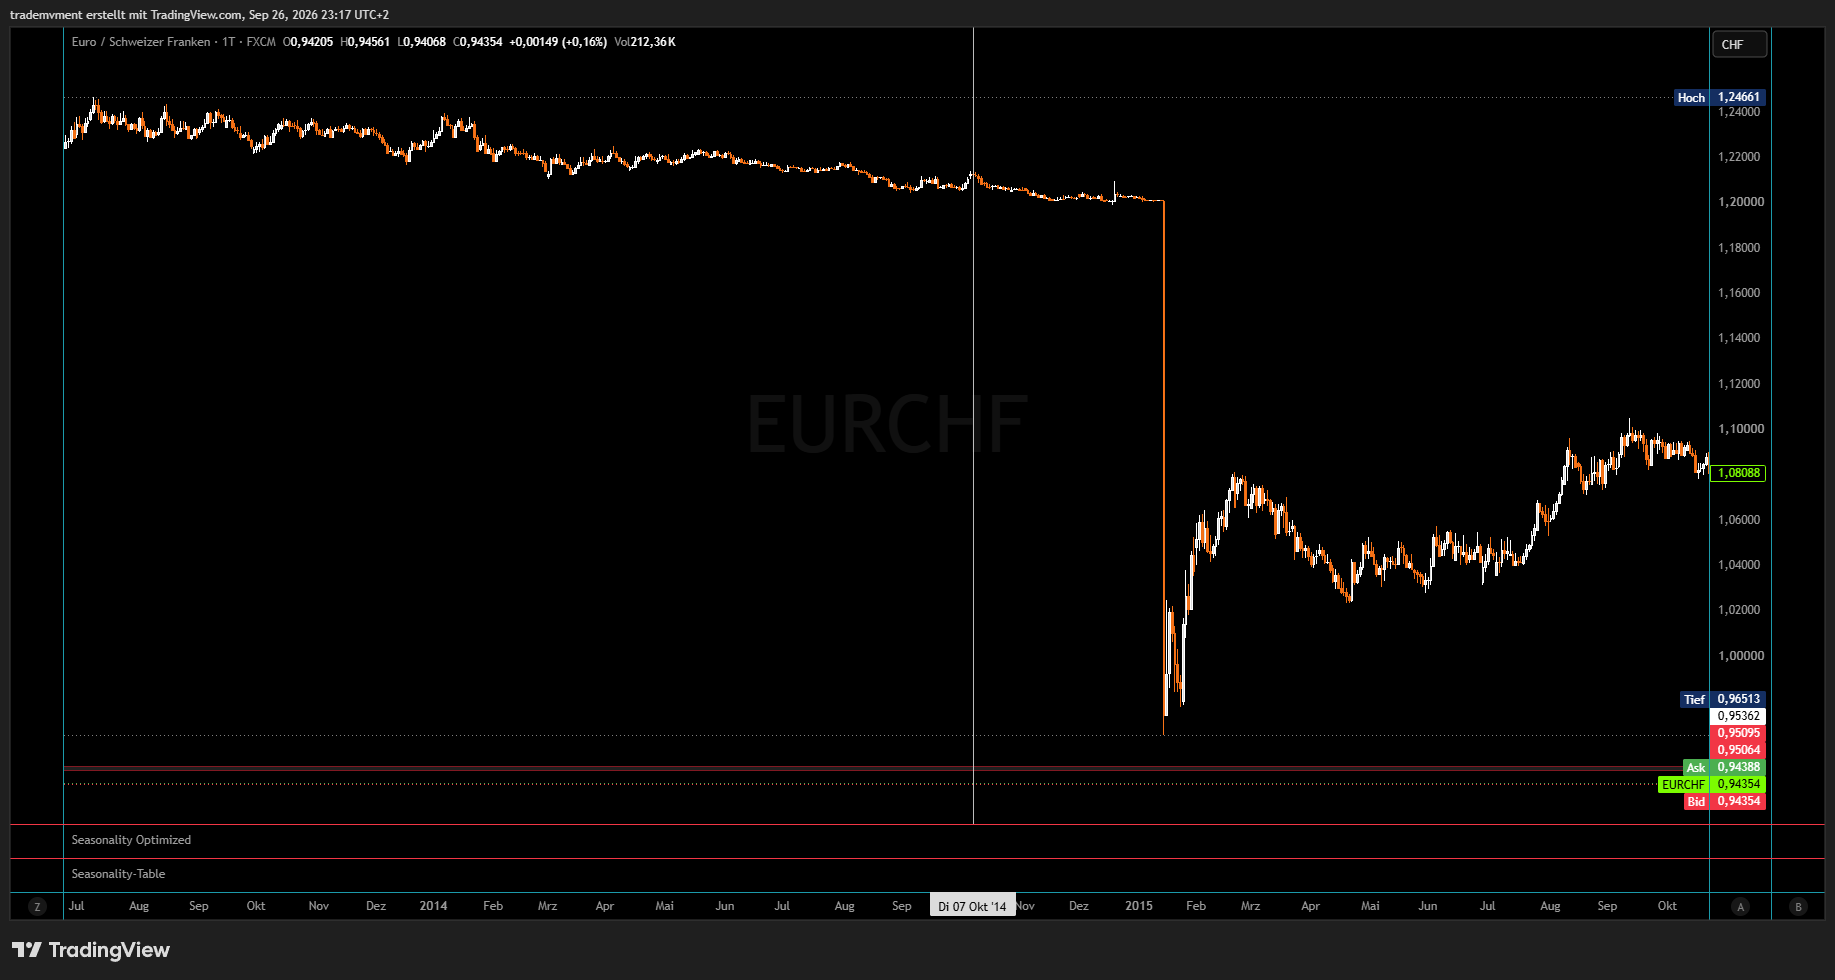
In the second chart, a local high is marked in early October 2014. EUR/CHF then fell further before the SNB removed the minimum exchange rate of EUR 1 = CHF 1.20 on 15 January 2015, followed by an extraordinary market move.
Source: snb.ch/en/publications/communication/press-releases/2015/pre_20150115
I do not assume a repeat of this specific event. The chart is also a reminder that during abrupt regime changes, liquidity and execution become more important than a neatly drawn price projection.
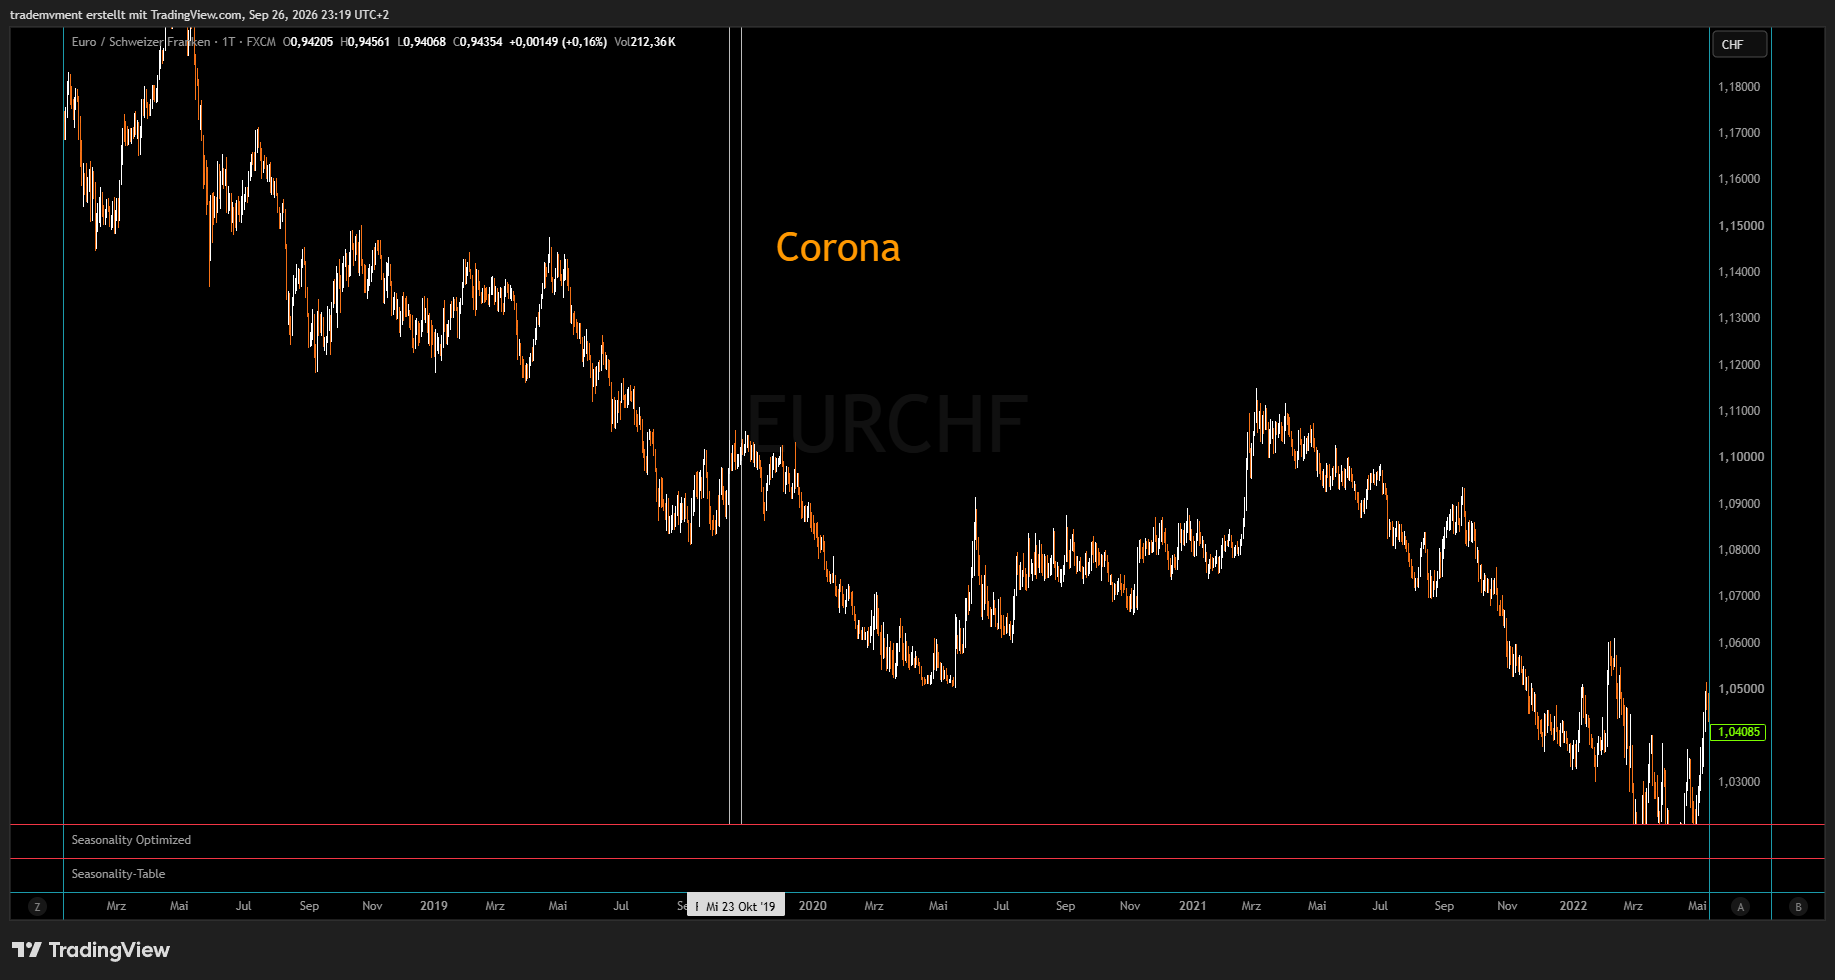
The third comparison shows a local high area in October 2019 and the subsequent decline into spring 2020. The marking is on 23 October, not in the first half of October. The decline also began before the later pandemic shock; the entire move therefore cannot retrospectively be explained by coronavirus.
These examples help me visualise possible paths. They are not a statistical study of all October periods and do not prove that the next major decline must begin in October again.
11. Connection to my WTI thesis
My previous WTI analysis
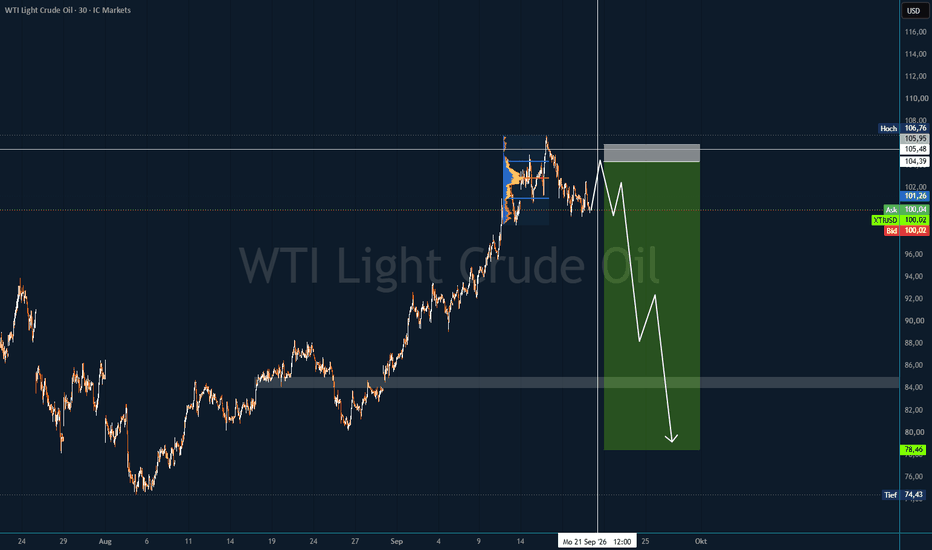
is based on a possible shift from supply-driven price pressure to demand-driven weakness: An energy shock weighs on purchasing power, margins and financing until the economic knock-on damage hits commodity demand more strongly.
This could fit a EUR/CHF short if the market simultaneously prices in weaker European growth and greater risk aversion.
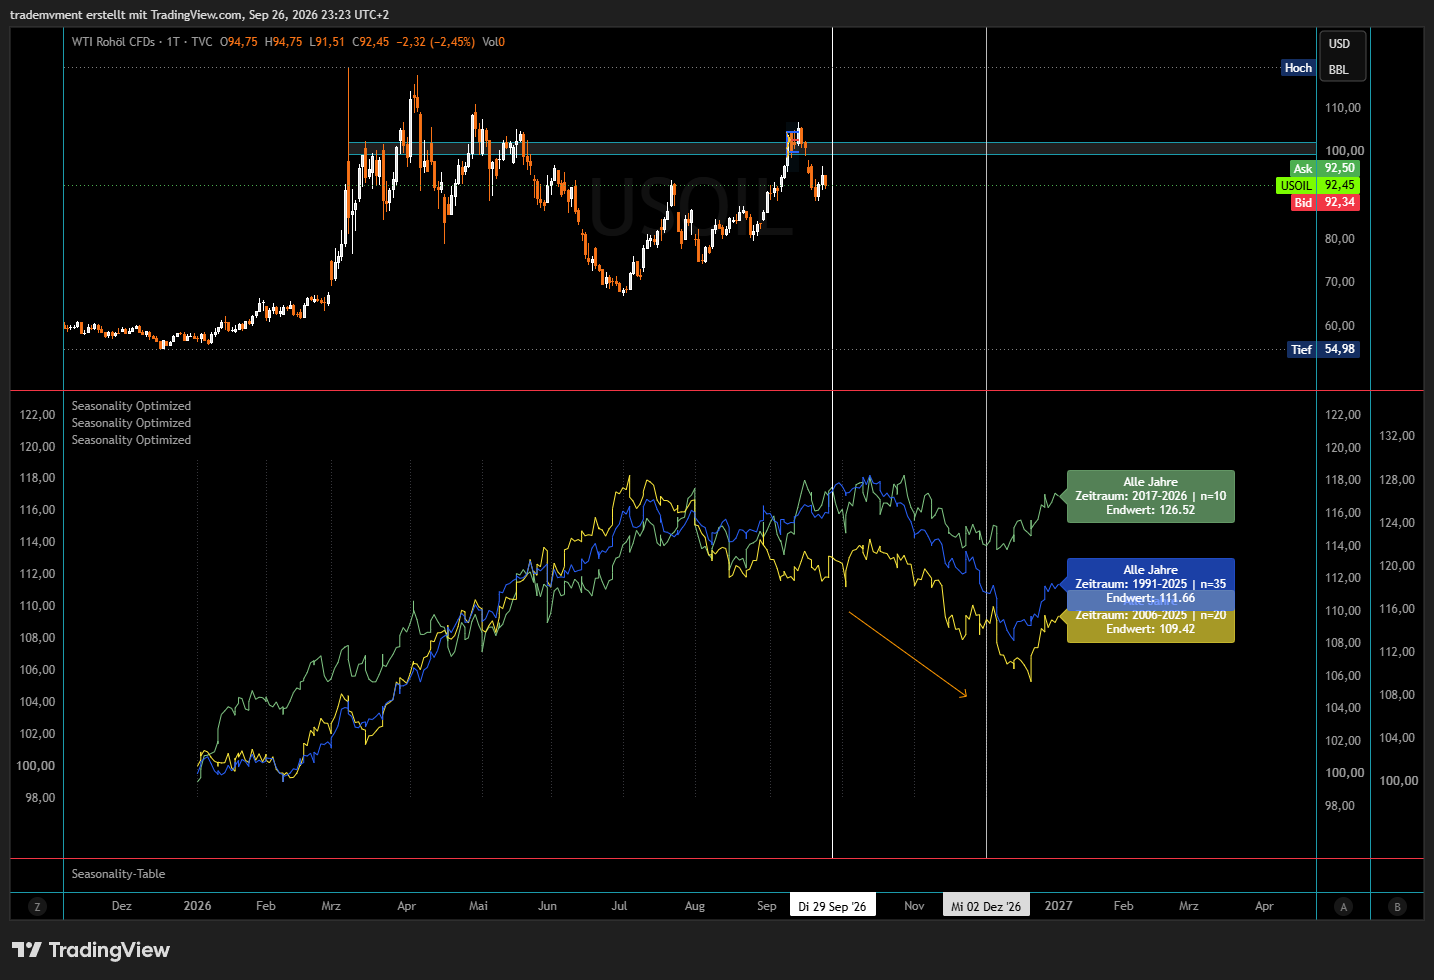
In the WTI chart too, the longer seasonal comparison series in particular show weakness later in the year. The more recent comparison series is less clear; I therefore do not consider every lookback equally strong confirmation.
Nevertheless, falling oil is not automatically bearish for the euro.
If oil falls because supply pressures ease, this can relieve Europe's purchasing power and costs. If it falls because of stronger global demand weakness, that is more consistent with my stress scenario. High European gas prices and falling WTI can also coexist; the two markets are not identical.
For me, therefore, it is not only price direction that matters, but the economic reason behind it.
12. Technical implementation of my EUR/CHF short
The main chart shows a planned entry after a further pullback into the upper price area. I do not assume that the order has already been filled.
Planned short entry: 0.94929
Stop-loss: 0.95461
Take-profit 1: 0.92223 — around 5.1 R.
Take-profit 2: 0.90465 — around 8.4 R.
Take-profit 3: 0.89008 — around 10 R.
My time horizon extends into early to mid-January 2027. The macroeconomic effects could last longer, but that does not create an obligation to hold this specific trade for that long.
Fundamentally, the idea loses weight if Europe's energy supply eases, consumption and the labour market remain resilient, and inflation falls without major damage to growth. The interest rate advantage could then support the euro longer than I assume in my scenario.
Stable risk appetite, continued CHF funding and an effective SNB counter-response would also be counterarguments. If the October window passes without confirmation from price and the environment, I must reassess the timing in particular.
Conclusion
I am looking for the possible combination of disappointing European growth and additional appreciation pressure on the Swiss franc.
The key is the relative development: The euro must weaken against the franc. For that, I need neither a certain crash nor the claim that Switzerland will be spared every problem.
And yes: Some old scrap of paper from the 19th century also reckons that 2026 might not be all that great for risk.
Original historical-book image attachment: Imgur album. The image could not be verified during the 17 October 2026 source review.
That probably would have been enough as an analysis too :)
— Believe what you want I believe in myself
Source review · 17 October 2026
Links reviewed on 17 October 2026. Supplementary source figures were added during this review; the original publication date and TradingView charts are preserved.
Dated updates
After · final review ·
Closed
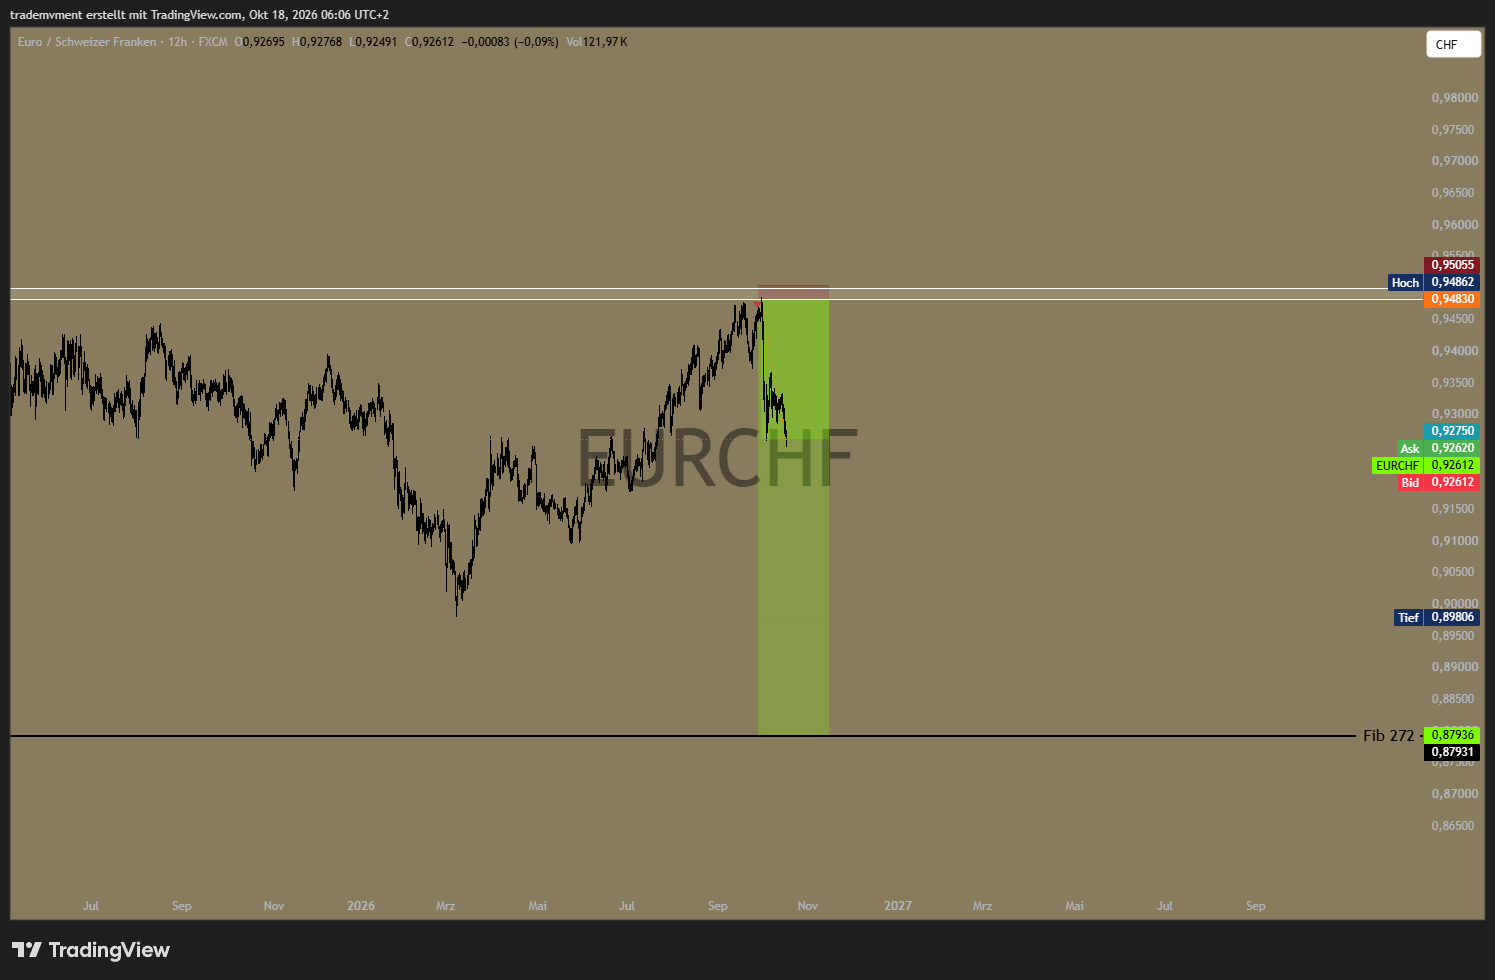
Trade closed — 18 October 2026
I have closed the EUR/CHF trade as an account-management decision. I had taken this position on a funded evaluation and had not opened it on my private accounts. The trade is now recorded as closed; the attached chart preserves the market snapshot accompanying this update.
Latest fundamental context — 15 October 2026
The SNB's latest presentation highlighted signs of a manufacturing recovery and said wider interest-rate differentials had contributed to franc depreciation. That remains a counterweight to the CHF-strength scenario in the original analysis. My closure records the account decision described above.
Source: SNB — Current economic developments and monetary policy, 15 October 2026.
Loading comments…