GBP/USD Long — Weekly Macro Setup
Original analysis
English edition of the original analysis by trademvment. Original TradingView publication ↗
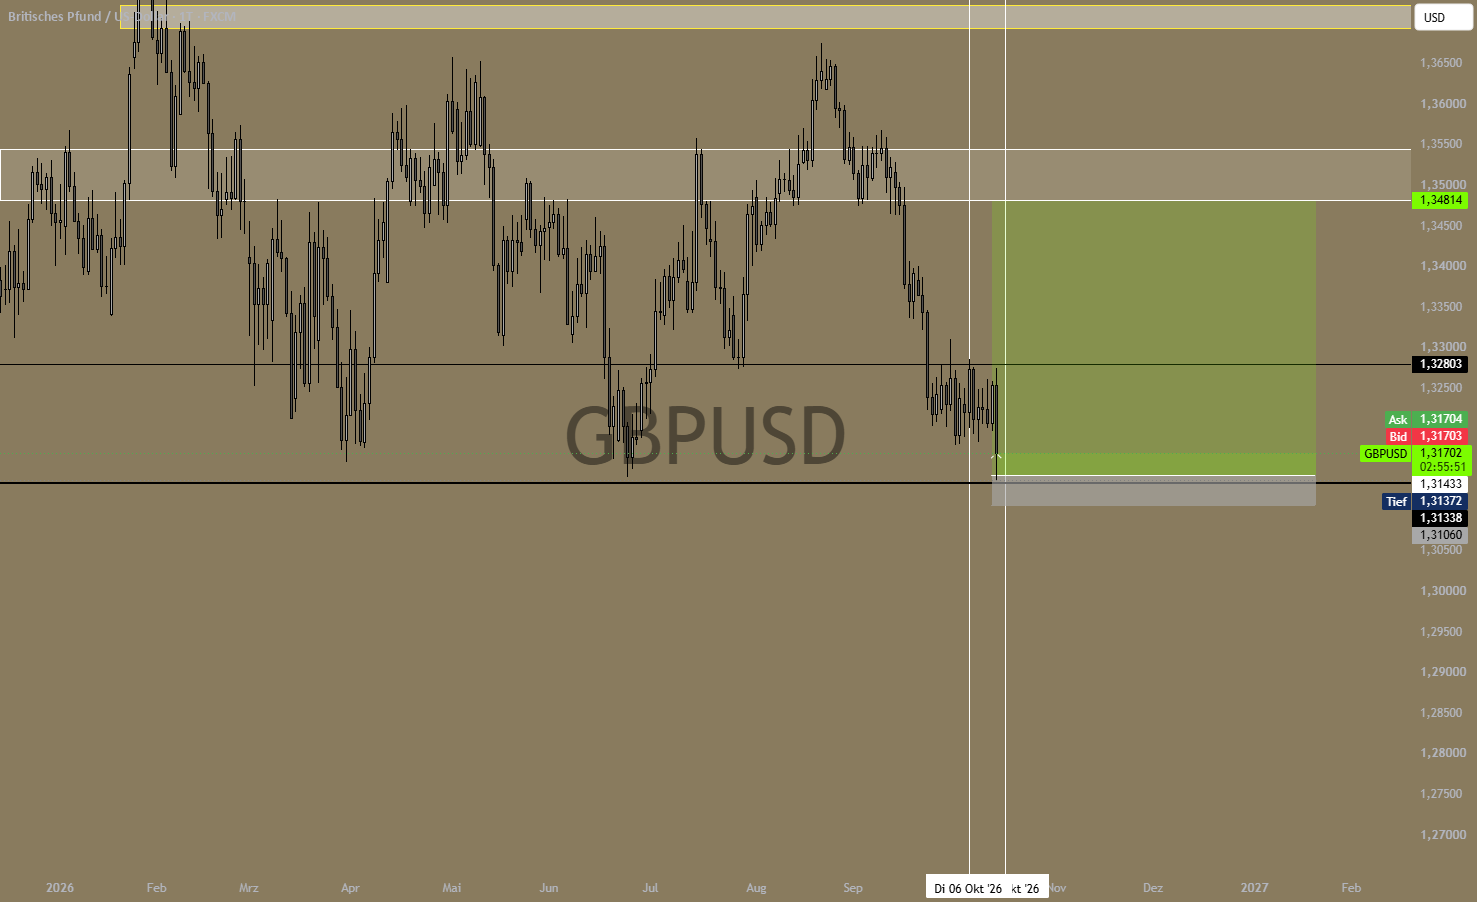
GBP/USD Long — Seasonal divergence and the Fed's dilemma
Bias: Long | Focus: October/November 2026 | Data as of: 14 October 2026
I see an interesting recovery setup in GBP/USD at a support zone that has been tested repeatedly. My idea combines seasonality, positioning in the dollar and pound, and the question of how long the Fed can continue tightening as labour market signals weaken.
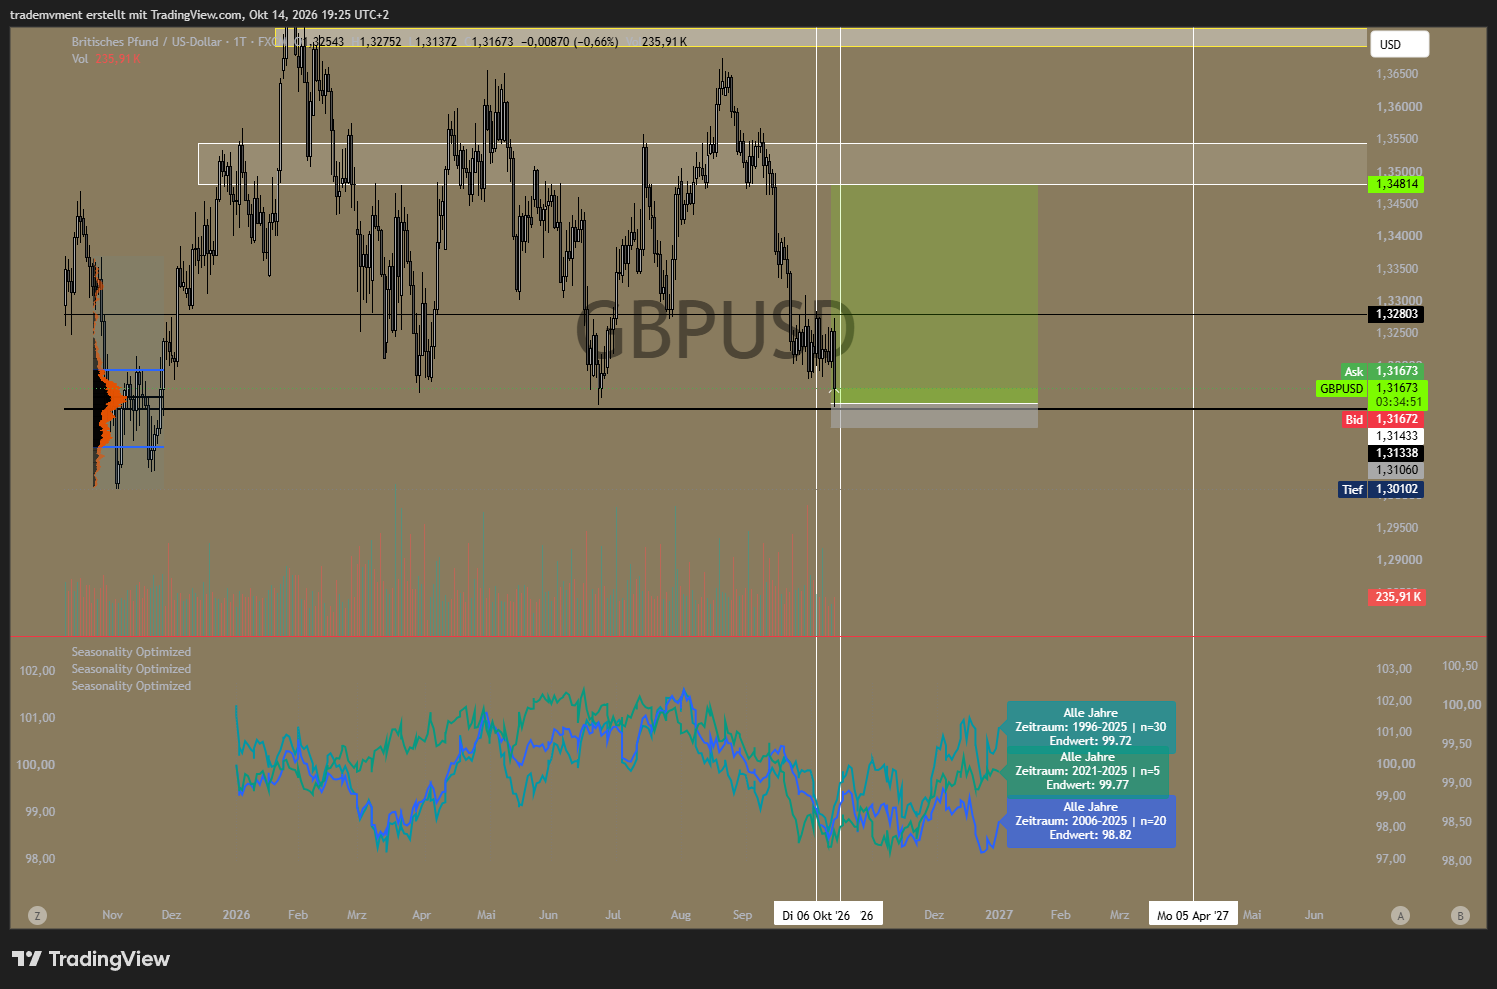
1. Seasonality: GBP has lagged, DXY has run far ahead
In the pound future, the current year's path is significantly below the seasonal comparison lines shown. Following the weaker late summer and early autumn, the historical pattern shows a potential recovery window from October into early November.
This divergence is precisely what interests me: Price is at support while the historical paths suggest a countermove.
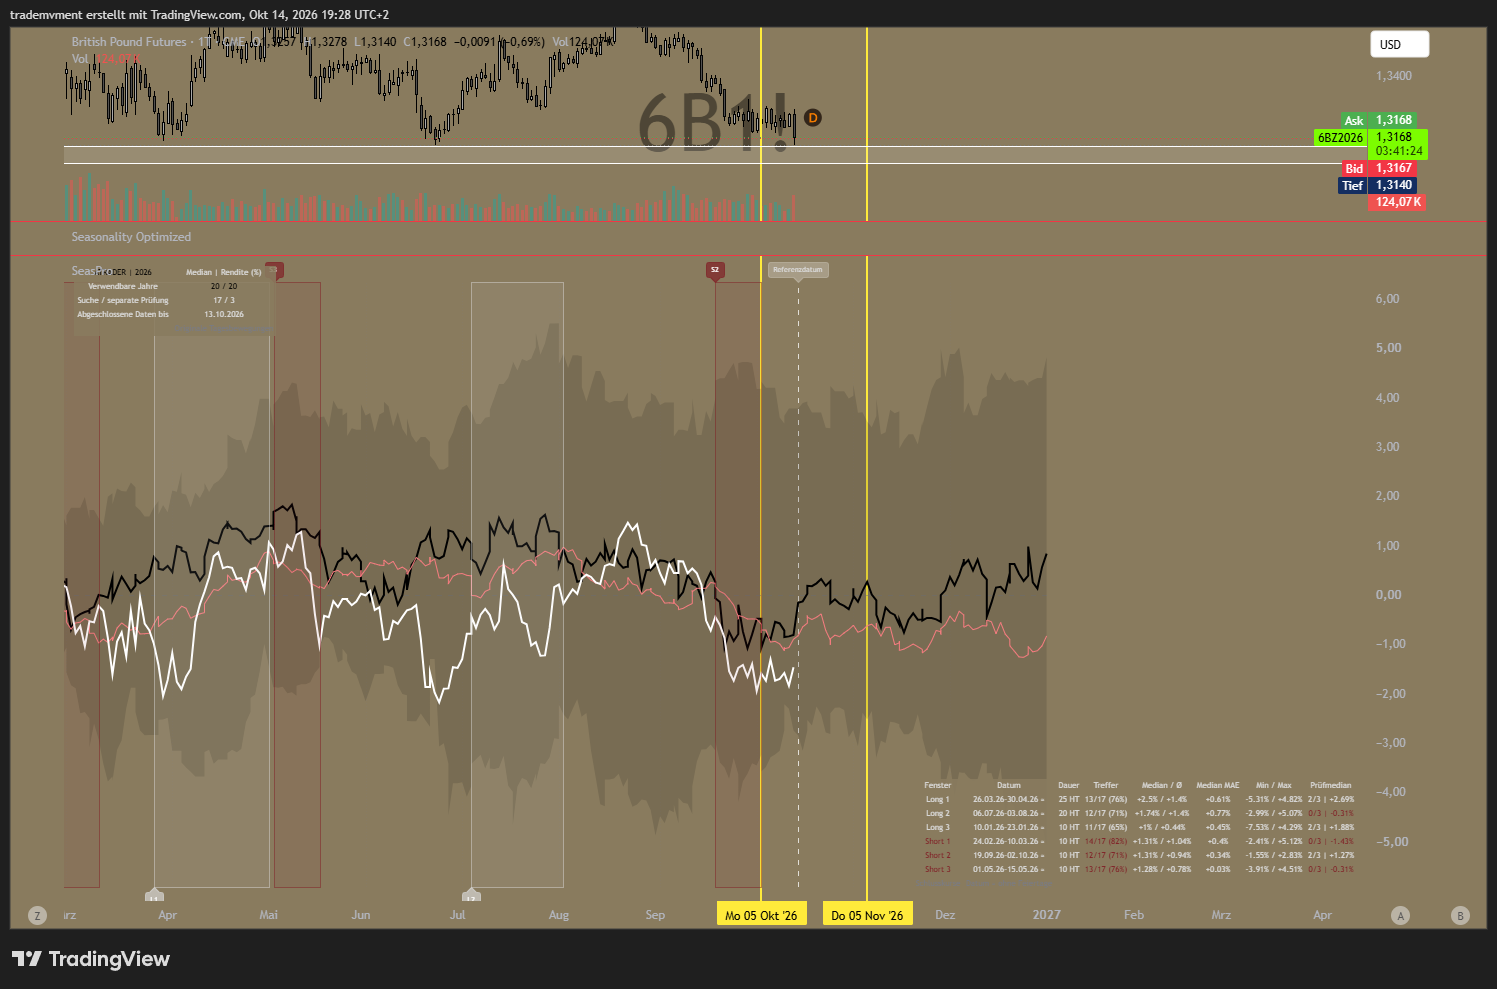
In the DXY, we see the opposite. The current path is significantly above the seasonal comparison lines, which tend to show weakness in the October window under consideration.
For me, this creates an interesting relative setup: Recovery potential in the pound meets a dollar that has run well ahead. The different historical periods serve as a guide for my timing.
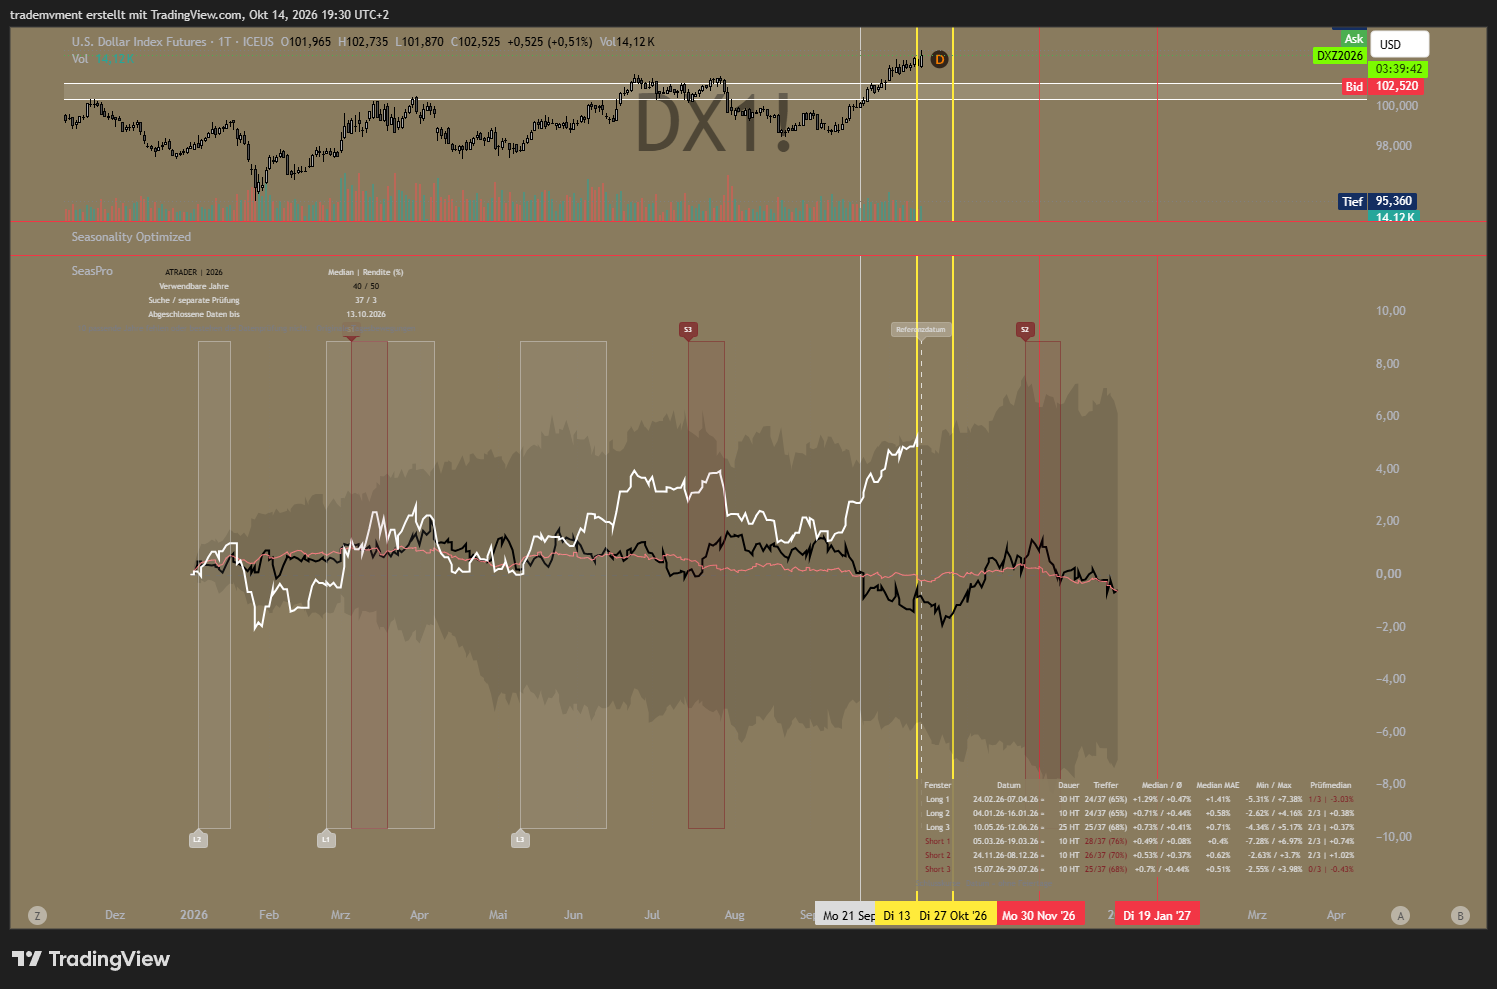
2. COT in the DXY: Read the short unwinding over the correct period
Across the broader chart, the reduction of previously high Commercial short holdings stands out. Because shorts are plotted as negative, a move in the short line towards zero means short positions are being reduced. Such covering can accompany an upward move.
The marked comparison with 2022 interests me as a possible pattern: Position changes can precede a larger trend reversal while the dollar initially continues rising.
However, the current weekly comparison matters: As of the 6 October reporting date, Commercial shorts increased again from 27,398 to 29,042 contracts. The unwinding visible over the broader period therefore did not continue during this latest reporting week.
The net positions in the linked chart are:
Commercials: −14,271 contracts.
Large speculators: +12,011 contracts.
Non-Reportables: +2,260 contracts.
The Non-Reportables shown as “Retail” are therefore net long the dollar. I use this as an additional contrarian signal. However, this position is not a historical extreme in the comparison shown.
Non-Reportables cover positions below reporting thresholds and are not a pure statistic of all private spot or CFD traders.
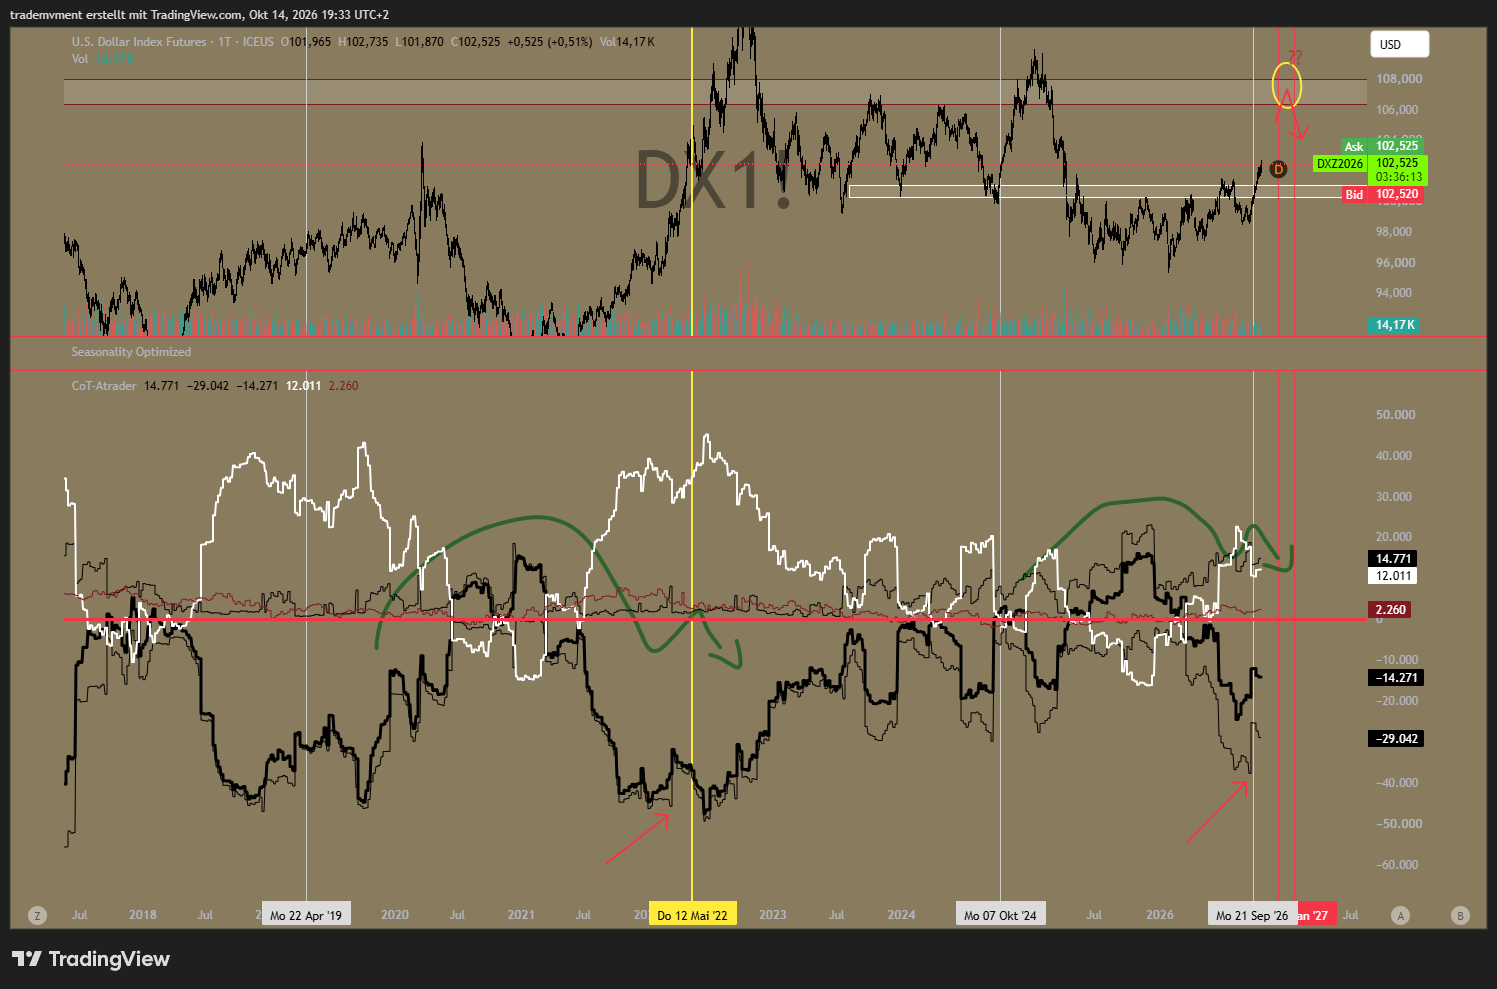
In the DXY, I have also marked the higher resistance zone around 106–108. Another dollar spike remains a possible scenario. Positioning therefore gives me context for a later reversal; I derive the GBP/USD entry from its own price zone.
3. GBP: My existing COT analysis remains the foundation
I have already described the detailed assessment of GBP positioning, including the retail side, in my GBP/JPY analysis:
de.tradingview.com/chart/GBPJPY/iqUiOipY/
The connection explained there between Commercial positioning, speculative shorts and the pound's resilience also forms the foundation of my GBP side here.
I follow the pound particularly as a monetary policy proxy for the Bank of England. Changes in UK rate expectations and yields can show up in the exchange rate. What matters for this trade is whether the pound gains relative strength against the dollar.
The BoE held its policy rate at 3.75% in September. Three of the nine members already wanted to raise it to 4.00%. The Bank continues to see elevated inflation risks. That can support UK rate expectations and consequently the pound.
4. The Fed between inflation and a weaker labour market
Today's US CPI data from 14 October can initially be interpreted as bullish for the dollar: Headline inflation rose to 3.7% year on year in September, with a monthly increase of 0.6%. The core rate was 2.6%.
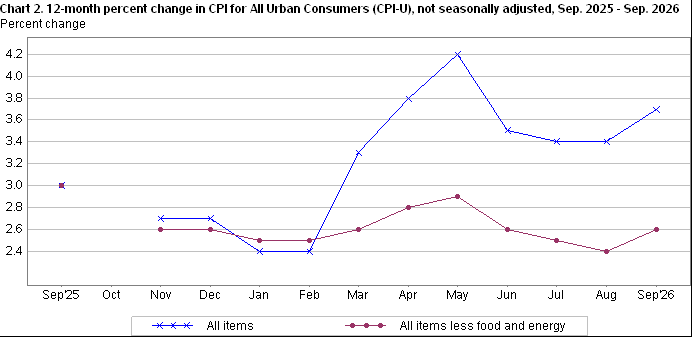
Higher price pressure can strengthen expectations of further rate increases or US rates remaining high for longer.
At the same time, my data overview shows several negative surprises, particularly in the labour market. Only 29,000 additional jobs were created in September. The unemployment rate was 4.2%, annual wage growth 3.0%. Employment figures for the two preceding months were also revised down.
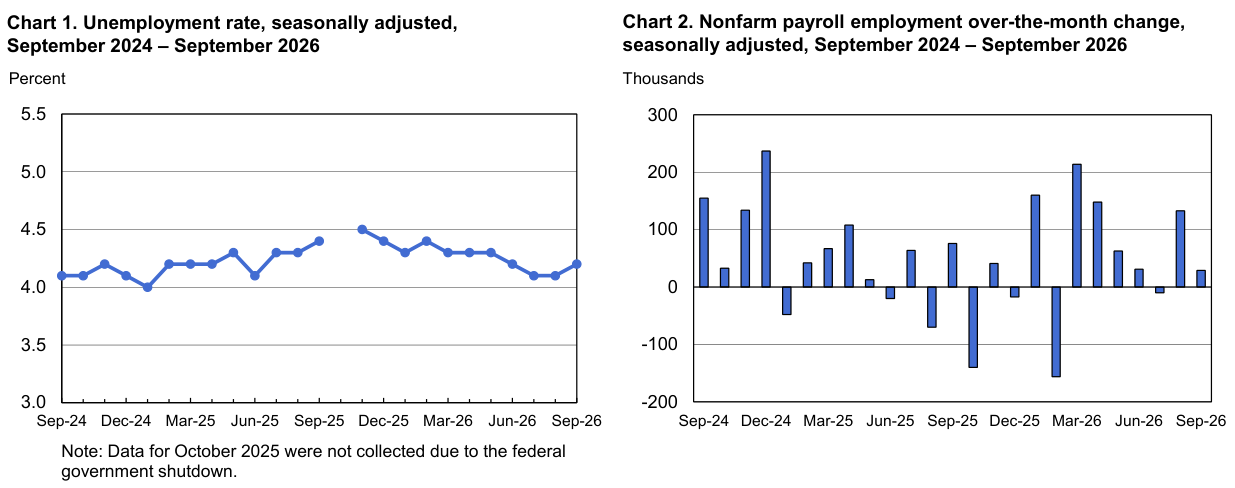
The growth picture is mixed: Weaker consumer confidence and disappointing PMI releases contrast with positive surprises in GDP, retail sales and industrial production. The PMIs remain above the expansion threshold of 50.
This is precisely where I see the Fed's dilemma: Further tightening can dampen price pressure but weighs on financing, investment and employment. Earlier easing would relieve the economy but could create new price risks if inflation remains persistent.
My thesis is that this conflict will intensify. For the dollar, what matters is when the market reassesses the expected US rate path.
5. The DXY responds relative to its countercurrencies
The Fed is not alone in facing inflation pressure. Higher rates are moving back up the agenda at several central banks. The ECB raised its policy rates by 25 basis points in September; within the BoE there are also voices calling for another increase.
The DXY measures the dollar against six currencies. The euro alone has a weight of 57.6%. That is why I watch developments in rate expectations outside the US just as closely.
If the market expects more tightening from the BoE or ECB while weaker US data limit the expected Fed rate path, the dollar's relative interest rate advantage could shrink. I see that as a possible source of pressure on the DXY.
6. Oil: My thesis remains demand destruction
High energy prices and expensive financing can eventually affect demand itself. Households lose real purchasing power, companies postpone investments and economic activity slows. That can subsequently weigh on demand for transport, fuel and oil.
I therefore continue to anticipate falling oil prices over time if demand weakness takes greater effect.
The IEA also expects a decline in global oil demand in its October report. At the same time, it continues to anticipate a market deficit through year-end because of supply problems. For my price thesis, demand weakness must sufficiently outweigh supply constraints and risk premiums.
For the USD, I am particularly interested in the effect on inflation and rate expectations: If oil prices and later fuel prices fall sustainably, energy inflation could ease. Together with weaker labour market data, this could limit room for further Fed hikes and later strengthen expectations of easing.
If this causes expected US yields to fall relative to other currency areas, the dollar can come under pressure over time.
An acute risk-off move can temporarily generate additional dollar demand. The pressure channel described here would work through the subsequent reassessment of the rate path.
7. My specific GBP/USD plan
The planned levels drawn in the main chart are:
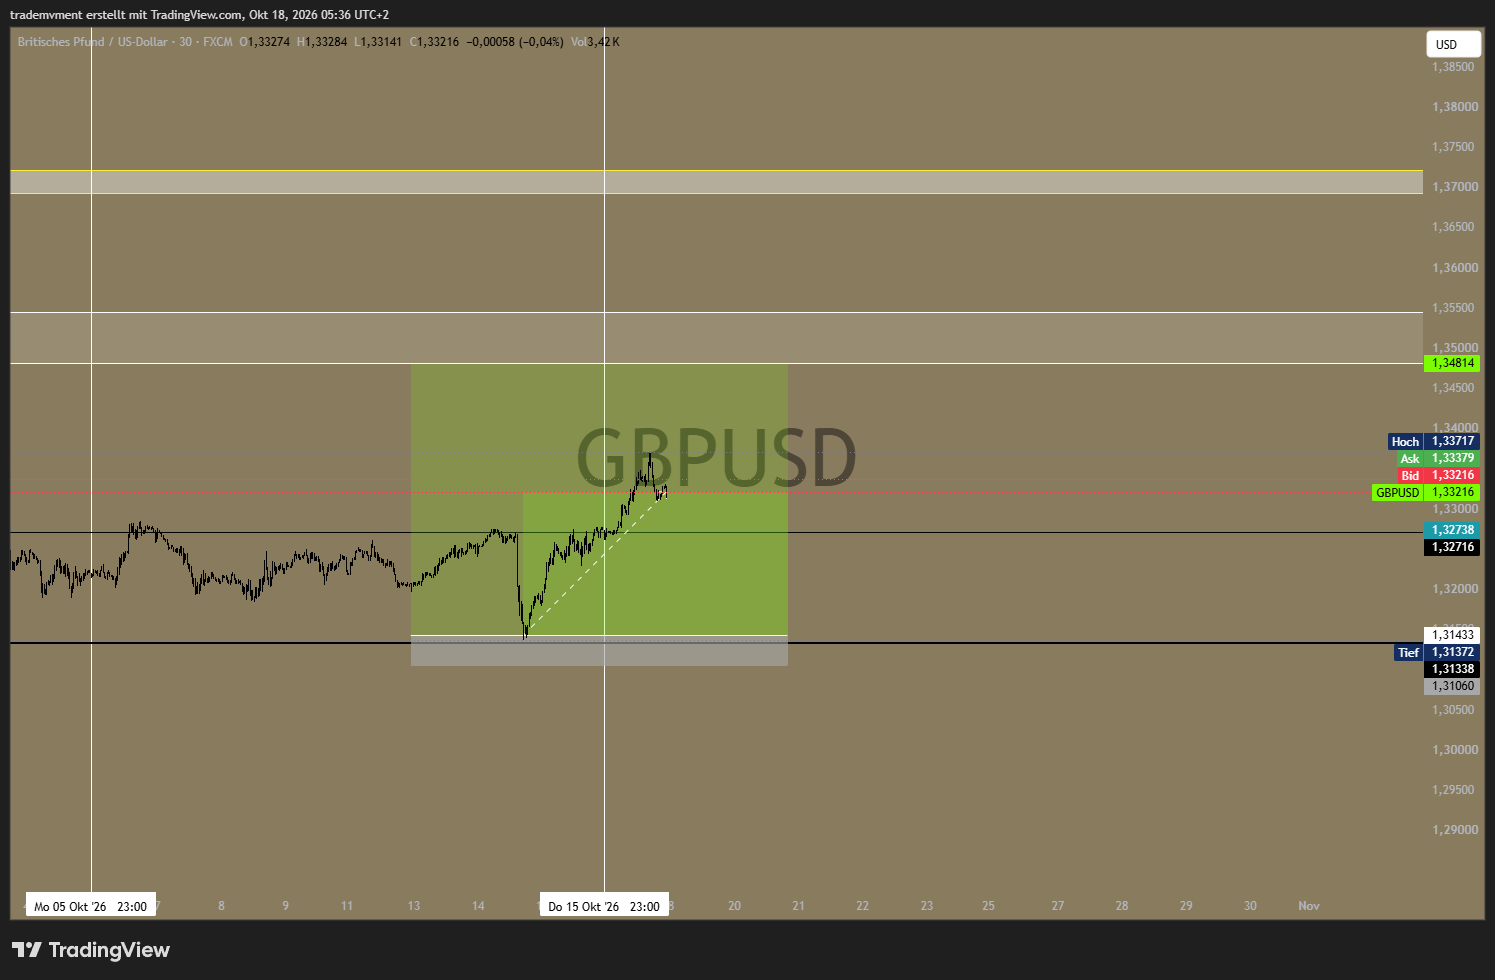
Entry: approximately $1.31433 per GBP, near the support zone around 1.3134–1.3143.
Stop: approximately 1.31060.
Intermediate level: 1.32803.
Target: 1.34814, at the lower edge of the upper resistance zone.
Between the entry, stop and target drawn in the chart, the calculated reward-to-risk ratio is approximately 9:1 before costs. This ratio changes with a different entry.
I am looking for a recovery from the lower part of the larger range. For this, I combine the seasonal window with positioning and my expectation that the dollar could lose support from the rate path over the medium term.
A further DXY rise would be a short-term headwind. Below the stop drawn in the chart, this specific trade is over for me.
My bias remains long GBP/USD for the autumn window under consideration.
Data basis: Charts from 14 October 2026; COT Legacy, futures-only, reporting date 6 October 2026. Scenarios for oil, interest rates and exchange rates are my interpretation.
Sources for cross-checking facts
CFTC: Historical Legacy futures-only reports — select 6 October 2026
Bank of England: September decision
IEA: Oil Market Report October 2026
Source review, 17 October 2026: BLS links now point to the original dated releases. The CFTC link opens its historical index; select 6 October 2026 and Legacy futures-only for the figures discussed here. Direct weekly downloads may be restricted by CFTC.
Source review · 17 October 2026
Links reviewed on 17 October 2026. Supplementary source figures were added during this review; the original publication date and TradingView charts are preserved.
Dated updates
Progress update ·
Following · stop at break-even
Position update — 18 October 2026
The GBP/USD long remains open. I have moved the stop to break-even and am letting the position run. The current TradingView chart and my position snapshot are attached below.
Fundamental update — UK data released 15 October 2026
The ONS reported August GDP growth of 0.1% month on month and 0.7% over the latest three months. My reading is that UK activity remains resilient, supporting the activity side of the original GBP thesis. It does not determine the next Bank of England decision; the dollar-rate risk described in the original analysis still matters.

Loading comments…