Rocky Mountain Chocolate Factory — 300–500% Target
Original analysis
English edition of the original analysis by trademvment. Original TradingView publication ↗
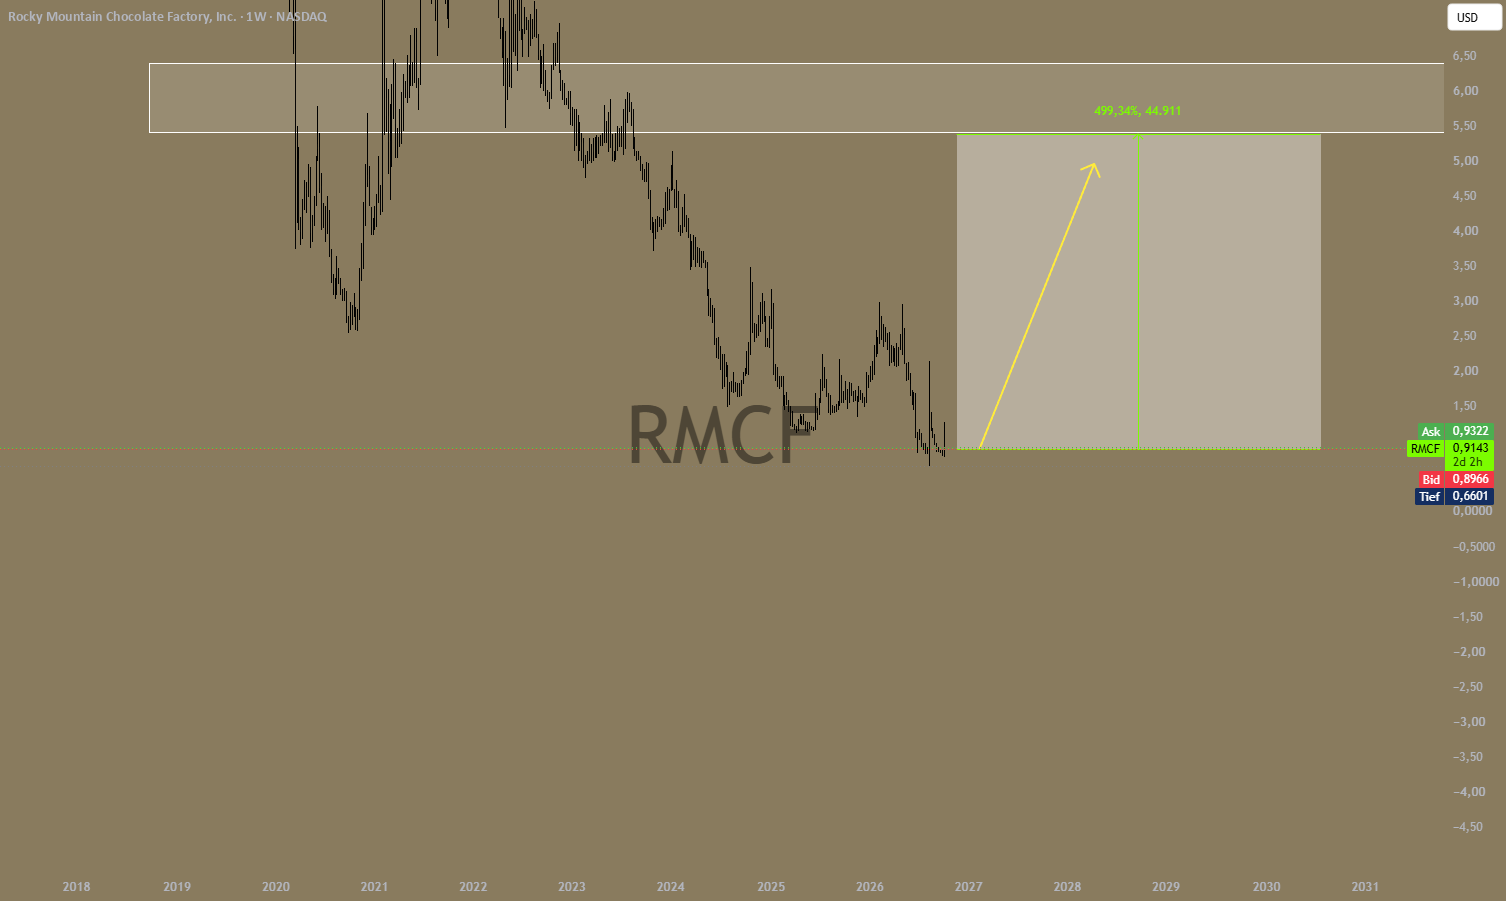
I see huge recovery potential in Rocky Mountain Chocolate Factory.
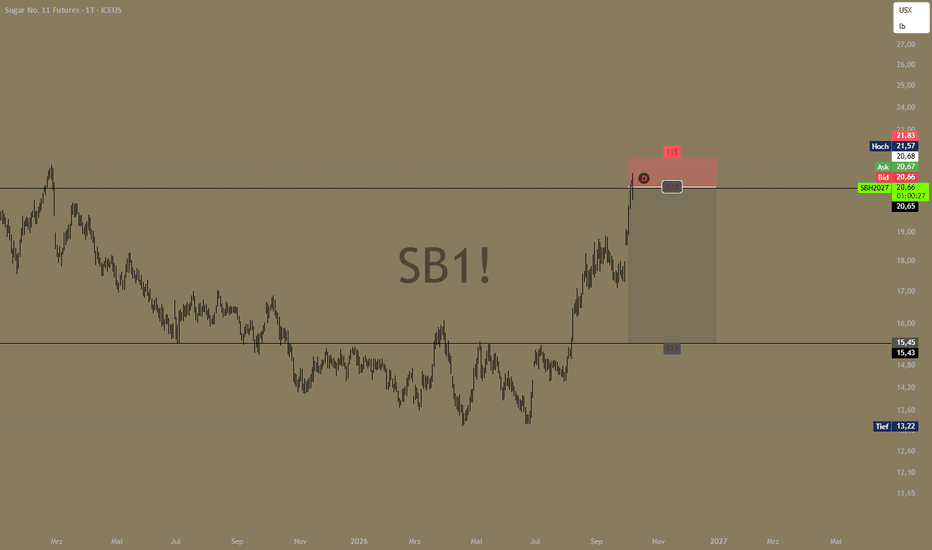
The entire idea is based on my sugar analysis, which is already published on my profile. There I explained why I anticipate a decline in the price of sugar.
de.tradingview.com/chart/SB1!/byp9lGJx/
My idea is simple
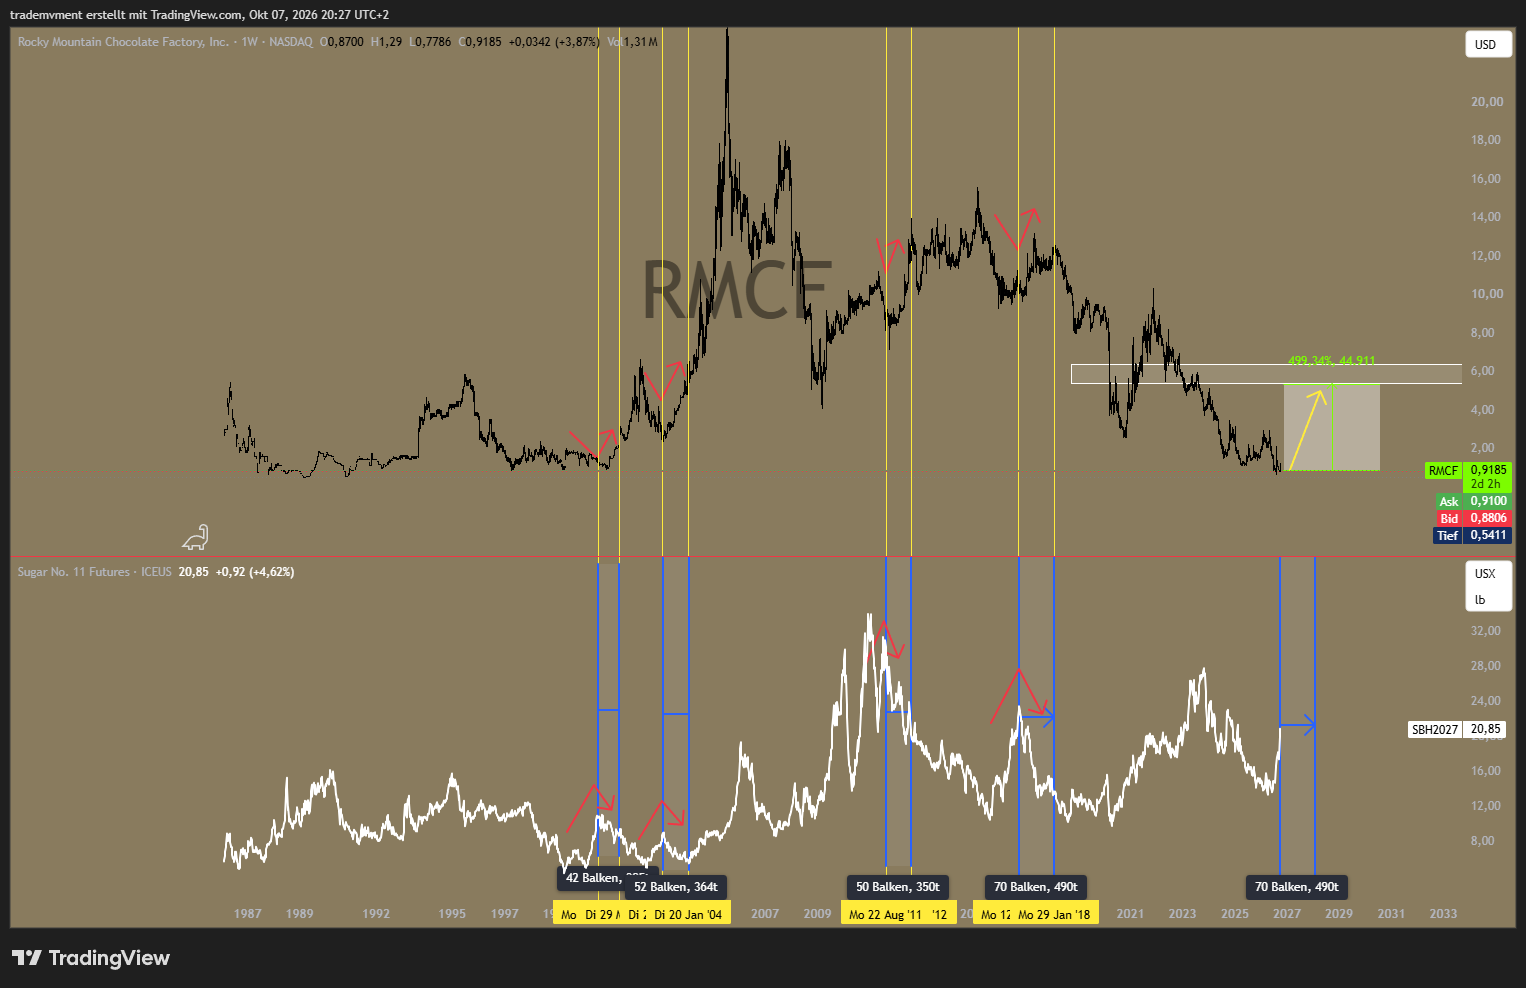
I expect a drop in sugar and am looking for the potential opposite move in RMCF. For me, this is a pure divergence trade based on seasonal patterns. The seasonal window comes from my sugar analysis; the following chart shows the historical comparison with RMCF.
Sugar analysis
The stock is on top, sugar below. In the marked historical periods, we repeatedly see falling sugar prices and a recovery in RMCF. That is exactly the opposing movement I want to trade again.
Revenue figures and current company developments do not interest me for this trade. My focus is on the seasonal window and the relationship between the commodity and the stock.
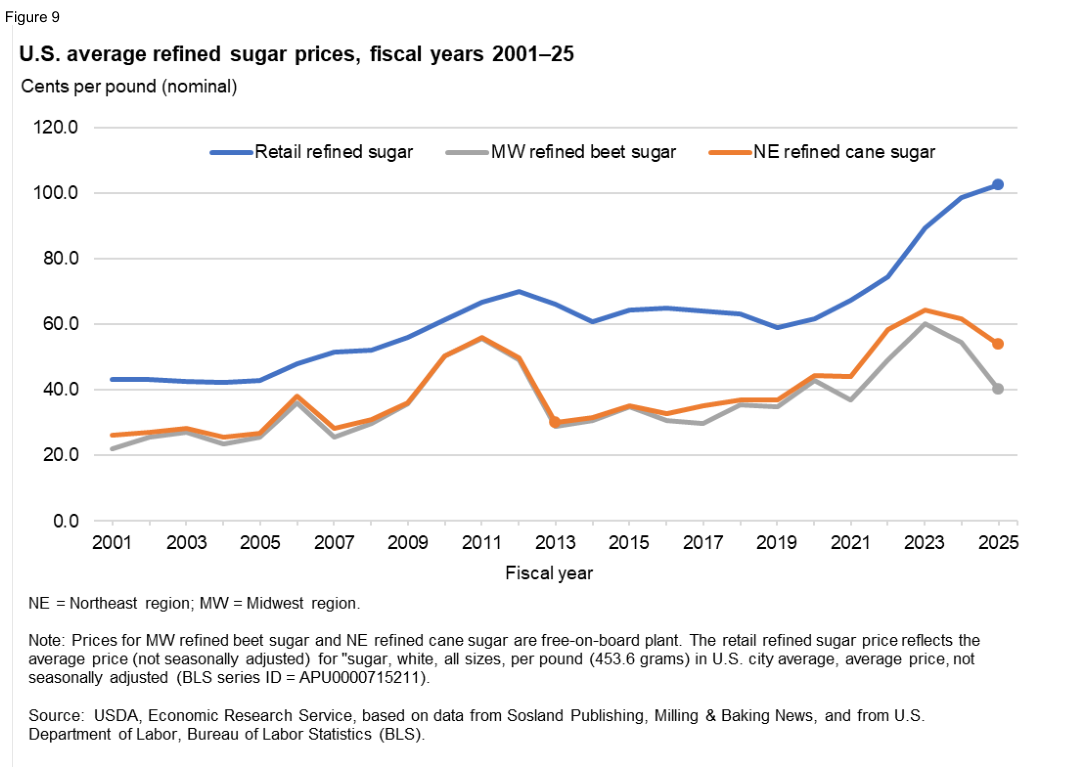
A possible tailwind for margins
Sugar is part of the company's raw material costs. If lower sugar prices also feed through into purchasing, this can reduce costs and ease pressure on margins. For me, that is an additional positive for this idea.
The scenario outlined in the chart offers roughly 500% upside potential. That is why I find RMCF so interesting in combination with my sugar thesis.
My thinking remains simple: weaker sugar, RMCF with recovery potential. That is precisely the divergence I am betting on.
Source review · 17 October 2026
Links reviewed on 17 October 2026. Supplementary source figures were added during this review; the original publication date and TradingView charts are preserved.
Loading comments…