The West Is Heading for Demand Destruction
Horizon: Q4 2026–2027

Economic research
My base case is that the West is heading into broad demand destruction and a deep recession. I expect the contraction to spread across most of the major Western economies from late 2026 into 2027, as the energy shock moves through household budgets, business margins, financing and employment.
The recession will develop through a sequence. Essential spending absorbs purchasing power. Businesses struggle to pass on costs. Restrictive financing makes that adjustment harder. Hiring slows, income security deteriorates and households cut spending again. By the time energy inflation retreats, the damage to demand will already have spread.
The argument in brief
- The inflation and employment signals are pulling in different directions. US September CPI inflation was 3.7%, while payrolls increased by only 29,000. The euro area's September inflation rate reached 3.8%.
- The policy response is adding pressure. The Fed and ECB raised rates in September; the RBA raised its cash rate to 4.60% on 29 September. Britain and Canada held rates, so the transmission differs by country.
- I expect the combination of higher essential costs, refinancing pressure and weaker employment to turn a supply shock into a sustained contraction in real spending. A further energy or agricultural shock will deepen that process if it arrives before incomes and balance sheets recover.
The figures above come from the BLS employment release of 2 October, BLS inflation release of 14 October, Eurostat's final September inflation release and the policy decisions cited below.
Scope and horizon. Here, the West means the United States, the euro area, the United Kingdom, Canada and Australia. I expect a common contractionary direction with different starting dates and severity. Switzerland enters the analysis through the franc and cross-border financing. Demand destruction means a sustained loss of real spending and production, not the disappearance of all economic activity. This is my economic forecast; the depth of the recession is a judgment, rather than the output of a calibrated GDP model.
1. The supply shock reduces what income can buy
The starting point is a deterioration in the availability and delivered cost of essential inputs. Oil, refined fuels, gas, electricity and transport connect almost every part of the economy. A persistent disruption therefore reaches well beyond the petrol pump.
An energy-importing economy must exchange more of its income for the energy it needs. The same quantity of imports becomes more expensive. Less purchasing power remains for other goods and services, unless wages, productivity, transfers or borrowing offset the loss.
This is a real resource problem. Raising interest rates cannot reopen a shipping route or replace damaged infrastructure. Monetary policy can influence how much demand competes for the remaining supply and whether the initial price shock becomes embedded in broader price setting. That distinction is central to my recession thesis.
There are winners as well as losers. Exporters, some producers and energy-related regions receive more revenue. But the extra income does not necessarily return immediately to the households and businesses cutting spending. Distribution, saving behaviour and the location of production determine how much of the loss is offset. For Europe in particular, the import burden matters directly.
The Middle East conflict is already part of this process. The IEA's October report describes renewed attacks on energy infrastructure and tanker traffic, fragile supply recovery and exceptional delivery costs. Its assessment also distinguishes crude availability from shortages of usable refined products. A barrel produced is not automatically a barrel delivered where it is needed. IEA, Oil Market Report, 14 October 2026.
My conclusion is that the economic burden will persist beyond individual headlines. Even a reduction in geopolitical risk will take time to work through transport, inventories, contracts and final prices.
2. Households and businesses must choose between prices, quantities and margins
Households cannot adjust every part of their budget equally. Heating, commuting, rent and basic food are difficult to cut quickly. When those costs rise, the first adjustment often occurs elsewhere: fewer restaurant visits, delayed purchases, a cheaper holiday or a car replacement postponed for another year.
A household can initially protect its lifestyle by saving less or borrowing more. Both responses delay the spending adjustment. Neither creates a lasting increase in real income. Once the buffer is depleted or credit becomes too expensive, the reduction in discretionary spending becomes harder to avoid.
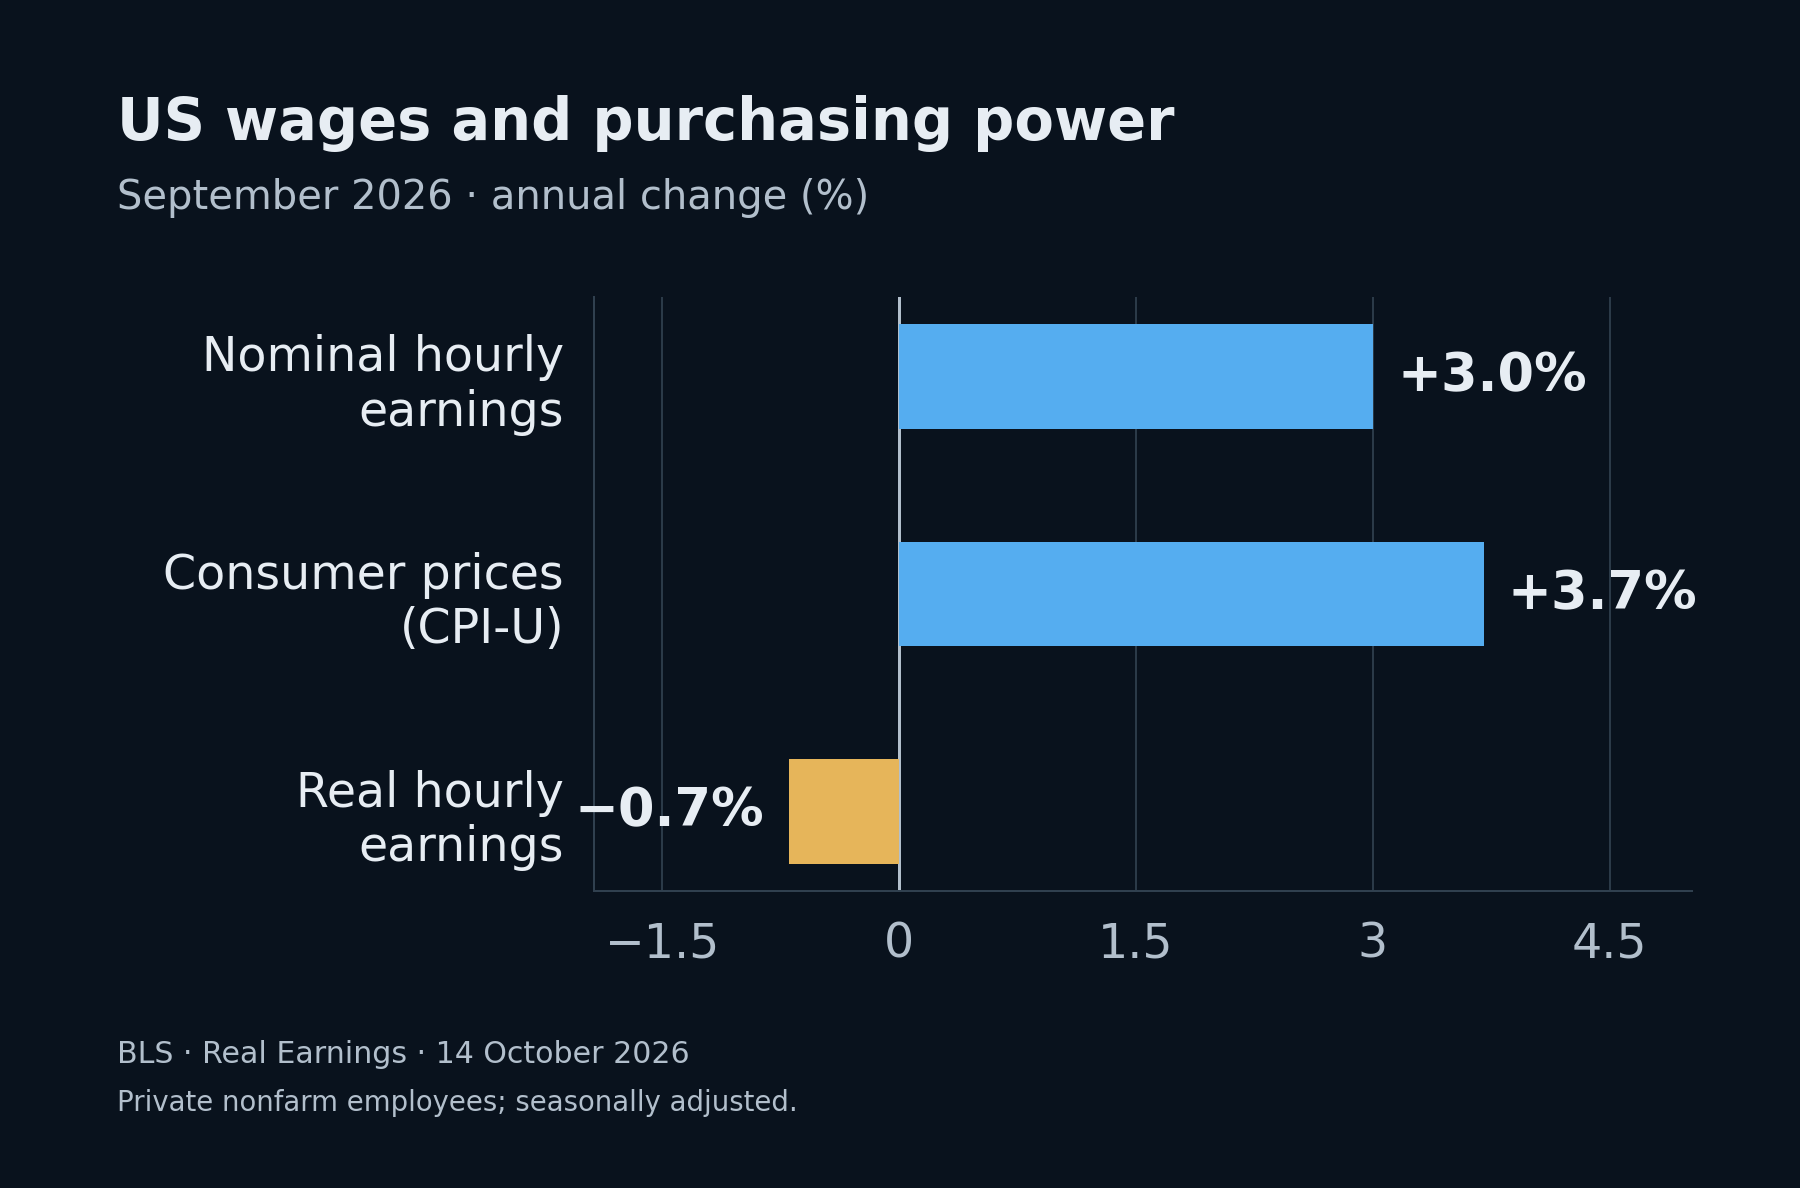
The purchasing-power squeeze is visible in wage statistics. In September, US real average hourly earnings fell 0.5% from the previous month and 0.7% from a year earlier. Nominal hourly pay was still rising, but consumer prices were rising faster. Real weekly earnings were down a smaller 0.1% over the year because average hours increased. These employee averages illustrate the wage channel; they are not a measure of every household's disposable income. BLS, Real Earnings, 14 October 2026.
Businesses face the same constraint from the other side. Revenue depends on both the price received and the quantity sold. Raising prices can preserve revenue per unit while losing customers. Holding prices steady protects volumes at the expense of margins. Cutting output or investment preserves cash but reduces activity elsewhere in the supply chain.
A simplified illustration: Suppose a business sells 100 units at a price of 10, with variable costs of 7 per unit and fixed costs of 200. Operating profit is 100. If variable costs rise to 8 and the selling price stays unchanged, operating profit falls to zero. Raising the price to 11 restores the original profit only if the business still sells 100 units. If sales fall to 80, profit is just 40. These are hypothetical figures illustrating operating leverage, not observed company results.
That is how a cost shock turns into a demand shock. Customers reduce purchases, suppliers lose orders and firms reduce spending to protect their own cash flow. An individual company's defensive decision becomes another company's revenue loss.
I expect the adjustment to be strongest where pricing power is weak, essential costs are a large share of income and financing is expensive. Nominal sales can remain firm during this phase because prices are higher. I will therefore judge the transition primarily through volumes, real expenditure, orders and employment, rather than nominal revenue alone.
3. A one-off price increase produces effects that last much longer
A higher energy price level is different from continuously accelerating inflation. If energy prices rise once and then stabilise, their direct contribution to annual inflation eventually fades. Household purchasing power does not automatically return to its previous level when that happens.
The transmission is also staggered. An energy hedge expires. A transport contract is renewed. A supplier increases its price list. A household moves onto a new tariff. The initial shock reaches different balance sheets at different times, so the drag on spending lasts longer than the first move in spot prices.
There are three separate processes. Direct effects raise the energy bill itself. Indirect effects raise the cost of goods and services produced using energy. Second-round effects arise if wages, price expectations and repeated price decisions make inflation more persistent. Treating all three as already established would overstate the evidence.
The Bank of England explicitly reported little evidence of material second-round effects in September, while warning that their risk grows as high and volatile energy prices persist. That gives policymakers a difficult choice: respond early to the risk of persistence, or wait for clearer evidence while the supply shock continues. Bank of England, September 2026 decision and minutes.
My forecast does not require an uncontrolled wage-price spiral. Delayed cost increases and a sustained loss of purchasing power are sufficient to weaken demand. Concern about inflation persistence then limits the speed of monetary relief.
This is why I expect stagflationary pressure to precede stronger demand-driven disinflation. Growth will weaken while essential prices remain uncomfortable. Later, the reduction in spending, employment and pricing power will bring a broader decline in inflation pressure. Those stages can overlap across countries and sectors.
4. Tighter financing turns the income squeeze into a balance-sheet squeeze
The second major transmission channel is the cost and availability of finance. A household paying more for essentials is more vulnerable when its mortgage resets. A business facing weaker margins is more vulnerable when debt matures or a working-capital facility is repriced.
The relevant financing cost is wider than the central bank's policy rate. Borrowers face market reference rates, term premia, credit spreads, fees and lending conditions. A policy-rate cut does not guarantee a cheaper or available loan if lenders simultaneously demand more compensation for risk.
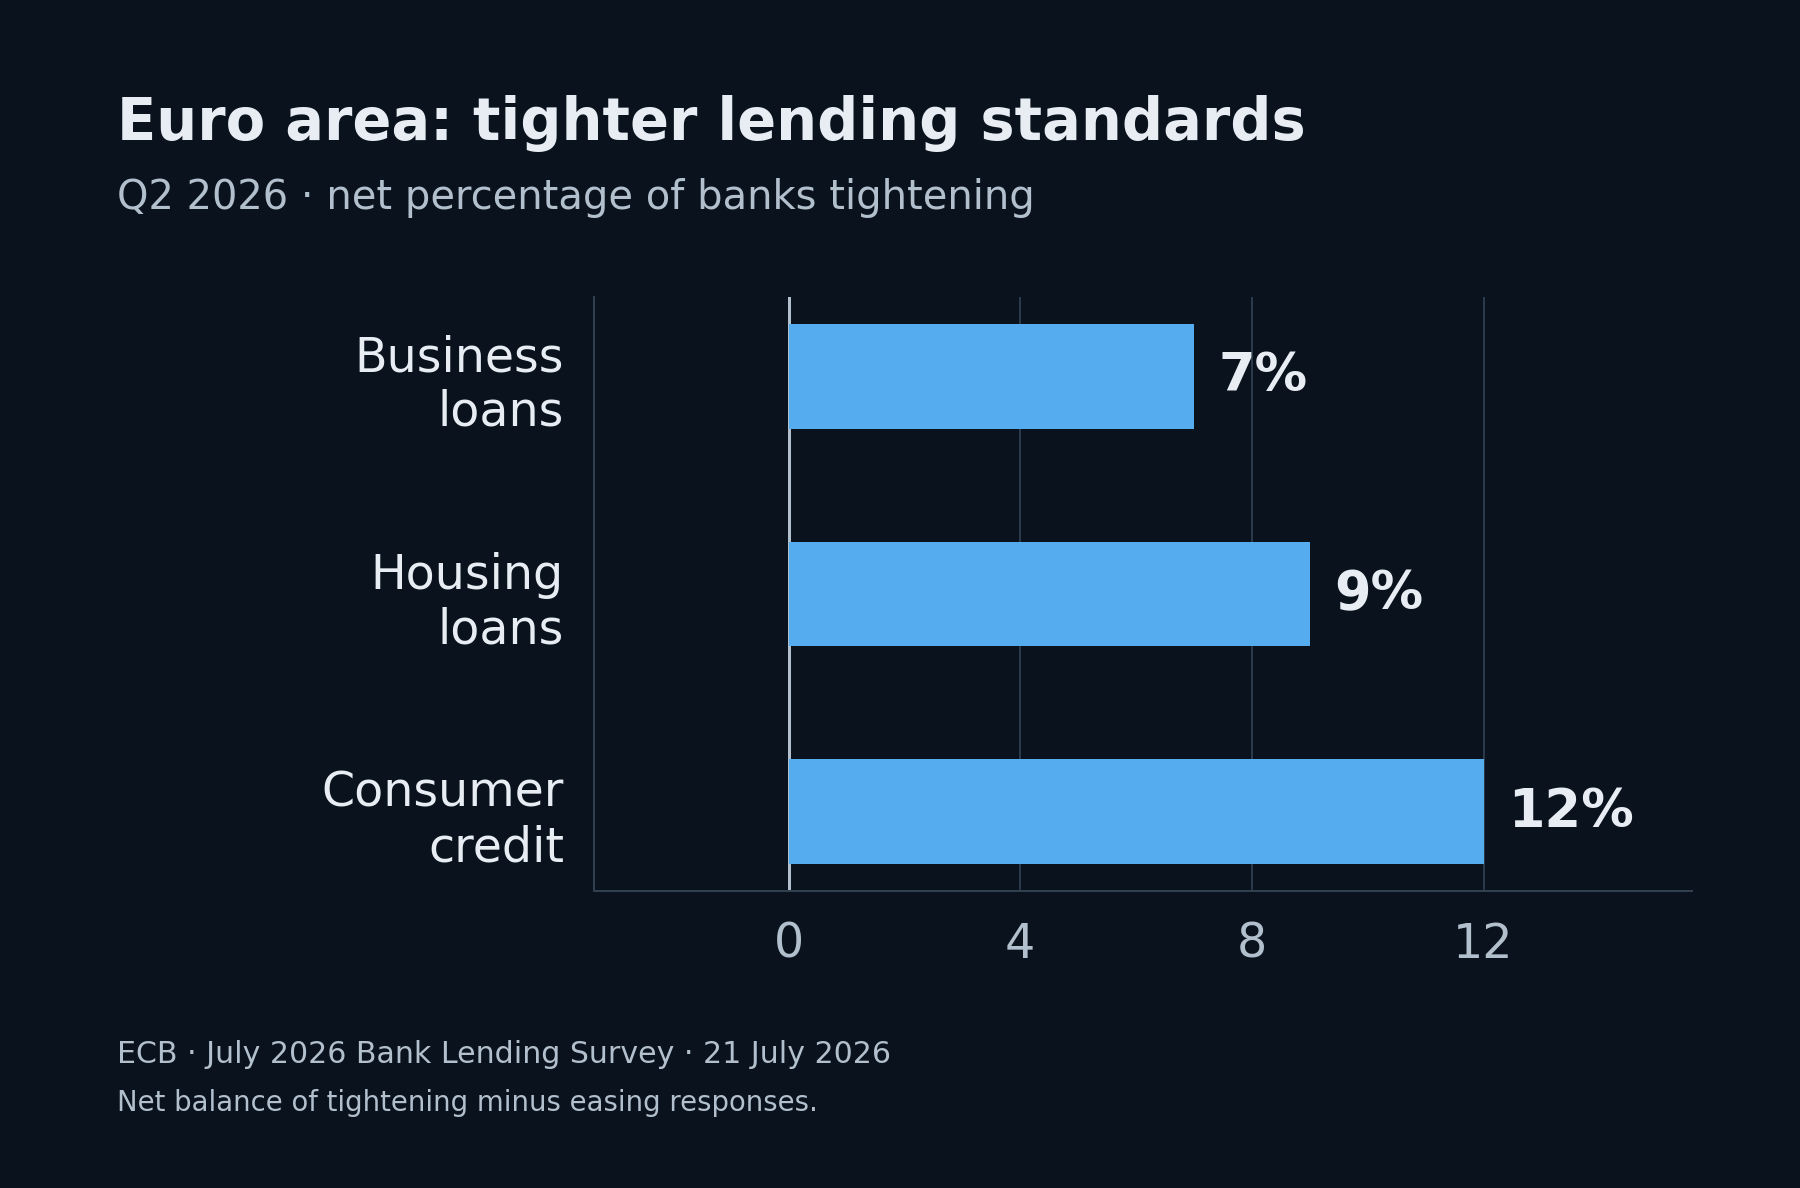
Banks were already tightening access to credit before the September rate increases. The ECB's July survey reported net tightening in Q2 for business loans, housing loans and consumer credit of 7%, 9% and 12%, respectively. These are the shares of banks reporting tighter standards minus the shares reporting easier standards, not percentage reductions in lending. Corporate loan demand still edged up, and business-loan tightening was less pronounced than in Q1. This is evidence of a financing constraint, rather than an established collapse in credit volumes. ECB, July 2026 Bank Lending Survey.
Refinancing creates a lag. Existing fixed-rate debt can protect borrowers for a period, making the economy appear resilient. As that debt matures, the higher cost reaches cash flow. New investment is exposed sooner because the proposed project must already clear today's funding hurdle.
Inflation also increases working-capital needs. Holding the same physical inventory costs more. Receivables become larger in money terms. If customers pay more slowly while suppliers require prompt payment, a business can need additional finance just as its lenders become more cautious.
Real interest rates require care. Subtracting today's headline inflation from a policy rate does not fully describe the incentive facing an investor or a borrower. Expected inflation over the relevant horizon, the debt contract and the actual lending rate matter. As inflation expectations fall, an unchanged nominal borrowing rate can become more restrictive in real terms.
The financial system can amplify the adjustment. Falling asset prices reduce collateral values. Lenders protect their balance sheets. Leveraged investors may sell assets to meet margin calls. Institutions promising liquid withdrawals against less liquid assets can face pressure precisely when buyers are scarce.
These are transmission mechanisms, rather than a claim that every institution is already in distress. The IMF's October Financial Stability Report describes resilient markets and a broadly resilient banking system alongside elevated risks, including sovereign-yield shocks, leverage and liquidity vulnerabilities outside banks. My recession forecast becomes more severe if those vulnerabilities amplify the real-economy slowdown. It does not depend on a repeat of 2008. IMF, Global Financial Stability Report, October 2026.
Government finance is part of the same constraint. Targeted support can cushion exposed households. Broad subsidies can transfer part of the energy bill to the public balance sheet. If financing that support raises sovereign yields or inflation expectations, some relief is offset by more expensive private credit. Fiscal capacity and market confidence therefore affect how effectively governments can interrupt the contraction.
5. Weaker margins become a labour-market problem
Employment is the hinge between an initial spending squeeze and a self-reinforcing recession.
Companies often respond to uncertainty before announcing large layoffs. They reduce vacancies, stop replacing departing staff, cut overtime, shorten working hours and delay expansion. Keeping existing workers can initially be rational if recruiting and training replacements would be expensive.
That adjustment protects employment for a time while weakening income growth and job opportunities. If orders and margins continue to deteriorate, labour retention becomes harder to finance. The process moves from fewer new jobs to a broader reduction in employment.
The household response then changes. People facing insecure hours or difficulty finding a new job postpone purchases. Some increase precautionary saving even before losing income. Job losses add a direct reduction in spending, and weaker sales trigger another round of business cuts.
Higher essential costs → weaker real spending → lower sales and margins → less hiring and investment → weaker labour income → another reduction in spending.
That feedback is why I expect the eventual downturn to be deeper than the initial energy shock alone would suggest. Energy-intensive industries are the first channel; domestic services, construction and consumer-facing businesses become exposed through their customers.
The latest labour releases already warrant attention, although they do not establish that every part of this chain is operating. The United States is still adding jobs. Canada's recent employment losses were heavily concentrated in the public sector. Australia's September decline came from part-time employment while full-time jobs increased. The country evidence below matters more than an undifferentiated claim that all labour markets are collapsing.
6. A policy pivot will not automatically reverse the process
I expect monetary easing to become more likely as the labour-market damage broadens and demand-driven disinflation strengthens. The timing will depend on inflation expectations, underlying price pressure, employment and financial conditions. Central banks do not follow a mechanical rule that a particular oil price or unemployment reading triggers a cut.
The policy conflict is especially difficult while the supply shock is still active. Cutting early can support demand and reduce debt-service pressure, but it cannot restore missing physical supply. If the decision weakens confidence in inflation control or the currency, imported costs and longer-term yields can rise.
Keeping policy restrictive protects credibility but exposes more borrowers to refinancing and more firms to weaker sales. I expect this delay between economic deterioration and convincing inflation relief to deepen the downturn.
Even after policy turns, transmission takes time. A lower overnight rate does not repair a failed business, restore a lost job or persuade a household to borrow when income is uncertain. Banks can remain cautious, credit spreads can stay elevated and borrowers can prioritise repayment over new spending.
Liquidity assistance and demand stimulus also serve different purposes. A central bank can support market functioning while keeping its policy rate restrictive. Emergency support for a market should therefore not automatically be read as the start of an easy-money cycle.
My forecast is that policy will eventually respond to the contraction, but relief will arrive after some of the income and balance-sheet damage has become difficult to reverse quickly.
7. A second supply wave will make the recovery more fragile
The most damaging extension of the sequence is another essential-cost shock before households and businesses have rebuilt their buffers. The first wave uses savings, margins and borrowing capacity to absorb the loss. A second wave reaches a less resilient economy.
A wider Middle East war would strengthen this channel through further damage to production, processing, export facilities or shipping. Higher insurance costs, rerouting and delivery delays can increase the final bill even where production continues. The economic effect depends on usable supply and the duration of disruption, rather than the number of alarming headlines.
That escalation is an additional assumption, not a military outcome I can establish from economic data. My recession thesis rests on the transmission of the existing shock. A wider conflict would increase the pressure and could prolong the period in which inflation constrains monetary easing.
Weather introduces another route. Poor harvests can raise food costs; disrupted hydropower or greater cooling needs can increase competition for energy. If food inflation accelerates as energy inflation starts to fade, households may receive less relief than the oil chart suggests.
The sequence is therefore more demanding than waiting for the first inflation peak. I expect the recovery to require sustained improvement in real incomes, financing and employment. Another supply shock before those conditions improve will delay it. Agricultural and El Niño risks deserve their own analysis in section 9.
8. The same pressure is reaching five economies through different channels
United States: renewed tightening meets weak job creation
The Federal Reserve raised its target range by 25 basis points to 3.75–4.00% on 16 September. Its statement described solid economic expansion, resilient spending and robust capital investment. That is meaningful evidence against calling the US economy already deeply recessionary. Federal Reserve, 16 September 2026.
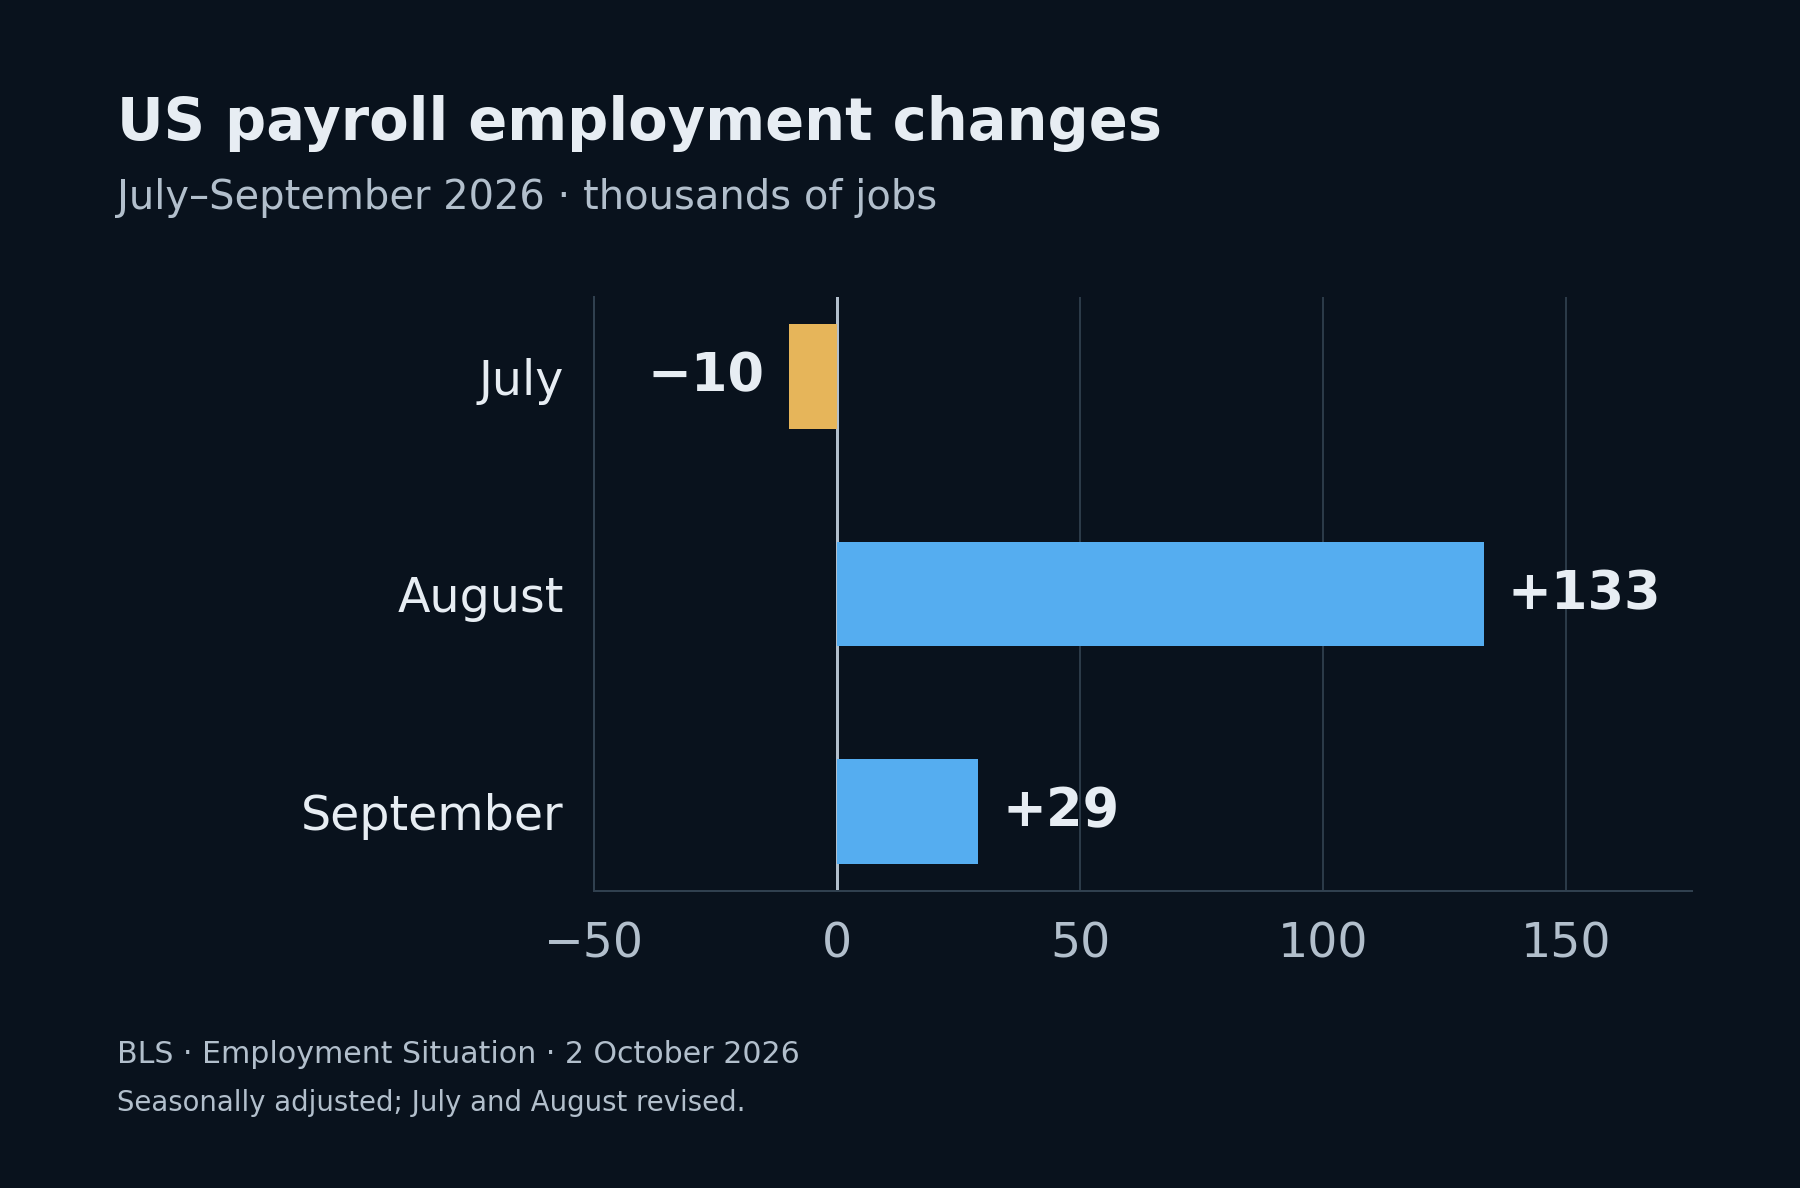
The September employment release nevertheless shows limited momentum: payrolls increased by 29,000, unemployment was 4.2% and July and August were revised down by a combined 60,000. The revised July, August and September increases average approximately 50,700 a month. One weak release is not a recession declaration, but that pace leaves less room to absorb a further slowdown. BLS, September employment.
September CPI rose 0.6% month on month and 3.7% year on year; core inflation was 2.6%. The gasoline index increased 9.1% in the month. These readings explain why the inflation constraint remains relevant even as employment growth weakens. BLS, September consumer prices.
I expect the gap between resilient aggregate spending and weak hiring to close through softer demand. US energy production, fixed-rate borrowing and investment strength provide buffers. The forecast rests on those buffers becoming insufficient as the energy burden and financing costs reach more of the economy.
Euro area: imported energy meets limited growth room
The euro area is particularly exposed to the interaction between imported energy costs and weak underlying growth. Higher import bills reduce purchasing power, while manufacturing and exporting businesses face pressure from both their costs and overseas customers.
The ECB raised its deposit rate to 2.50% in September. Its baseline still projected positive GDP growth of 0.9% in 2026 and 1.4% in 2027, with the revisions reflecting greater resilience. My recession call is explicitly more negative than that baseline. I expect the indirect effects of the shock and the financing response to outweigh the resilience recorded so far. ECB, September policy decision and projections.
Eurostat's final September release, published on 16 October, put inflation at 3.8%, up from 3.2% in August. Energy prices were 18.9% above a year earlier and contributed 1.71 percentage points to annual inflation. That combination makes rapid relief more difficult while the real economy adjusts. Eurostat, final September HICP.
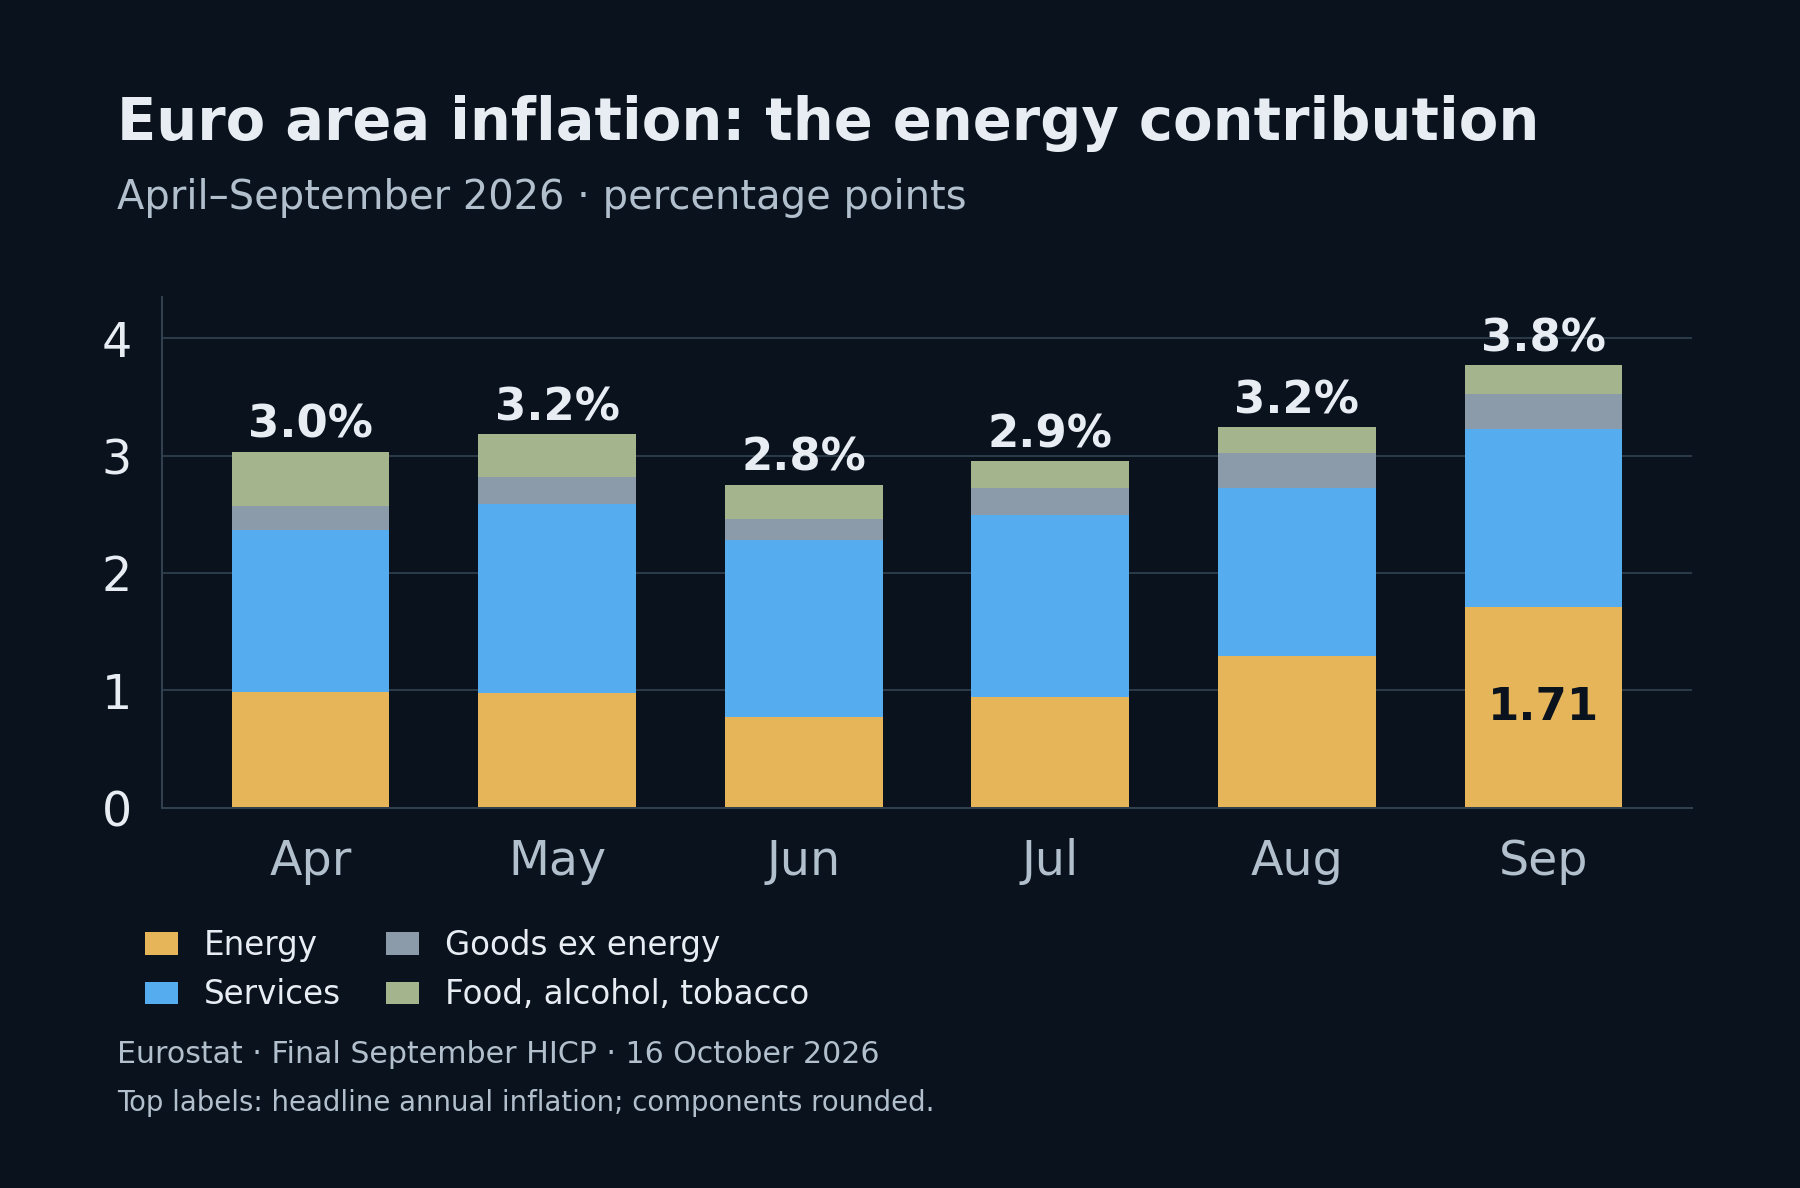
The energy contribution rose from 0.99 percentage points in April to 1.71 in September. That September contribution represents approximately 45% of the reported 3.8% headline rate. This is different from saying that energy makes up 45% of household expenditure. The figure makes the policy tension visible: energy is adding to inflation while leaving households less income to spend elsewhere.
My expectation is a broadening contraction from energy-sensitive production into consumption, services and employment. Different fiscal positions and industrial structures will produce substantial differences within the currency union.
United Kingdom: the inflation and employment conflict is already visible
The Bank of England held Bank Rate at 3.75% in September, with three of nine members preferring an increase to 4.00%. It described soft labour-market conditions alongside upside inflation risks. The minutes also recorded two-year fixed mortgage quotes around 95 basis points above their pre-conflict level. Bank of England, September decision and minutes.
That is the policy conflict in practical form. Mortgage refinancing and higher essential bills reduce what households can spend, while inflation risk keeps a sustained easing cycle from being straightforward.
I expect domestic demand to weaken further as those costs reach more borrowers. A temporarily supported pound or firmer interest-rate expectations would not demonstrate that the British economy is healthy. Currency pricing can reflect expected relative returns while the domestic economy deteriorates.
Canada: the latest employment report weakens the recovery picture
Canadian employment fell by 68,000 in September after a 42,000 decline in August. Unemployment increased to 6.5%. However, the September report also recorded a 70,000 fall in public-sector employment, while private-sector employee numbers were little changed. The aggregate decline cannot honestly be presented as direct proof of widespread private-sector margin-driven layoffs. Statistics Canada, September Labour Force Survey, 9 October.
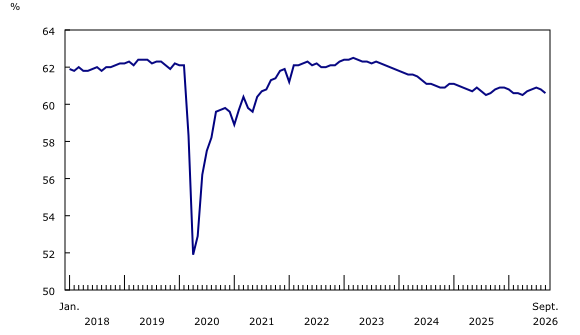
The employment rate fell 0.2 percentage points in September to 60.6%, its second consecutive monthly decrease, although it was unchanged from a year earlier. This adds context to the recent loss of momentum without equating it with the pandemic collapse shown in the historical chart. Population ageing also affects this rate. Source: Statistics Canada, Labour Force Survey, September 2026. Reproduced and distributed on an "as is" basis with the permission of Statistics Canada. Original release and figure.
It still matters for spending: a lost public-sector income is a lost source of household demand. I expect weaker income momentum and debt-service pressure to restrain consumption, with spillovers into private businesses.
Canada's energy exports provide an offset, and the Bank of Canada held its policy rate at 2.25% in September. Its position is therefore different from a fresh domestic rate-hiking cycle. My bearish view depends on the balance between that support and the weakness of household demand, employment and external customers. Bank of Canada, 2 September decision.
Australia: a concrete warning after the latest rate increase
The RBA raised its cash rate by 25 basis points to 4.60% on 29 September, its fourth increase of 2026. It judged inflation too high while also describing an economy that appeared to be slowing. RBA, 29 September decision.
The labour report released on 15 October then showed September employment down 39,300 and unemployment at 4.7%. Full-time employment increased by 34,400, while part-time employment fell by 73,700. This is a warning about momentum, rather than evidence that all categories of employment are contracting. The report's release after the rate decision does not establish that the late-September hike caused the September employment decline. ABS, Labour Force, September 2026.
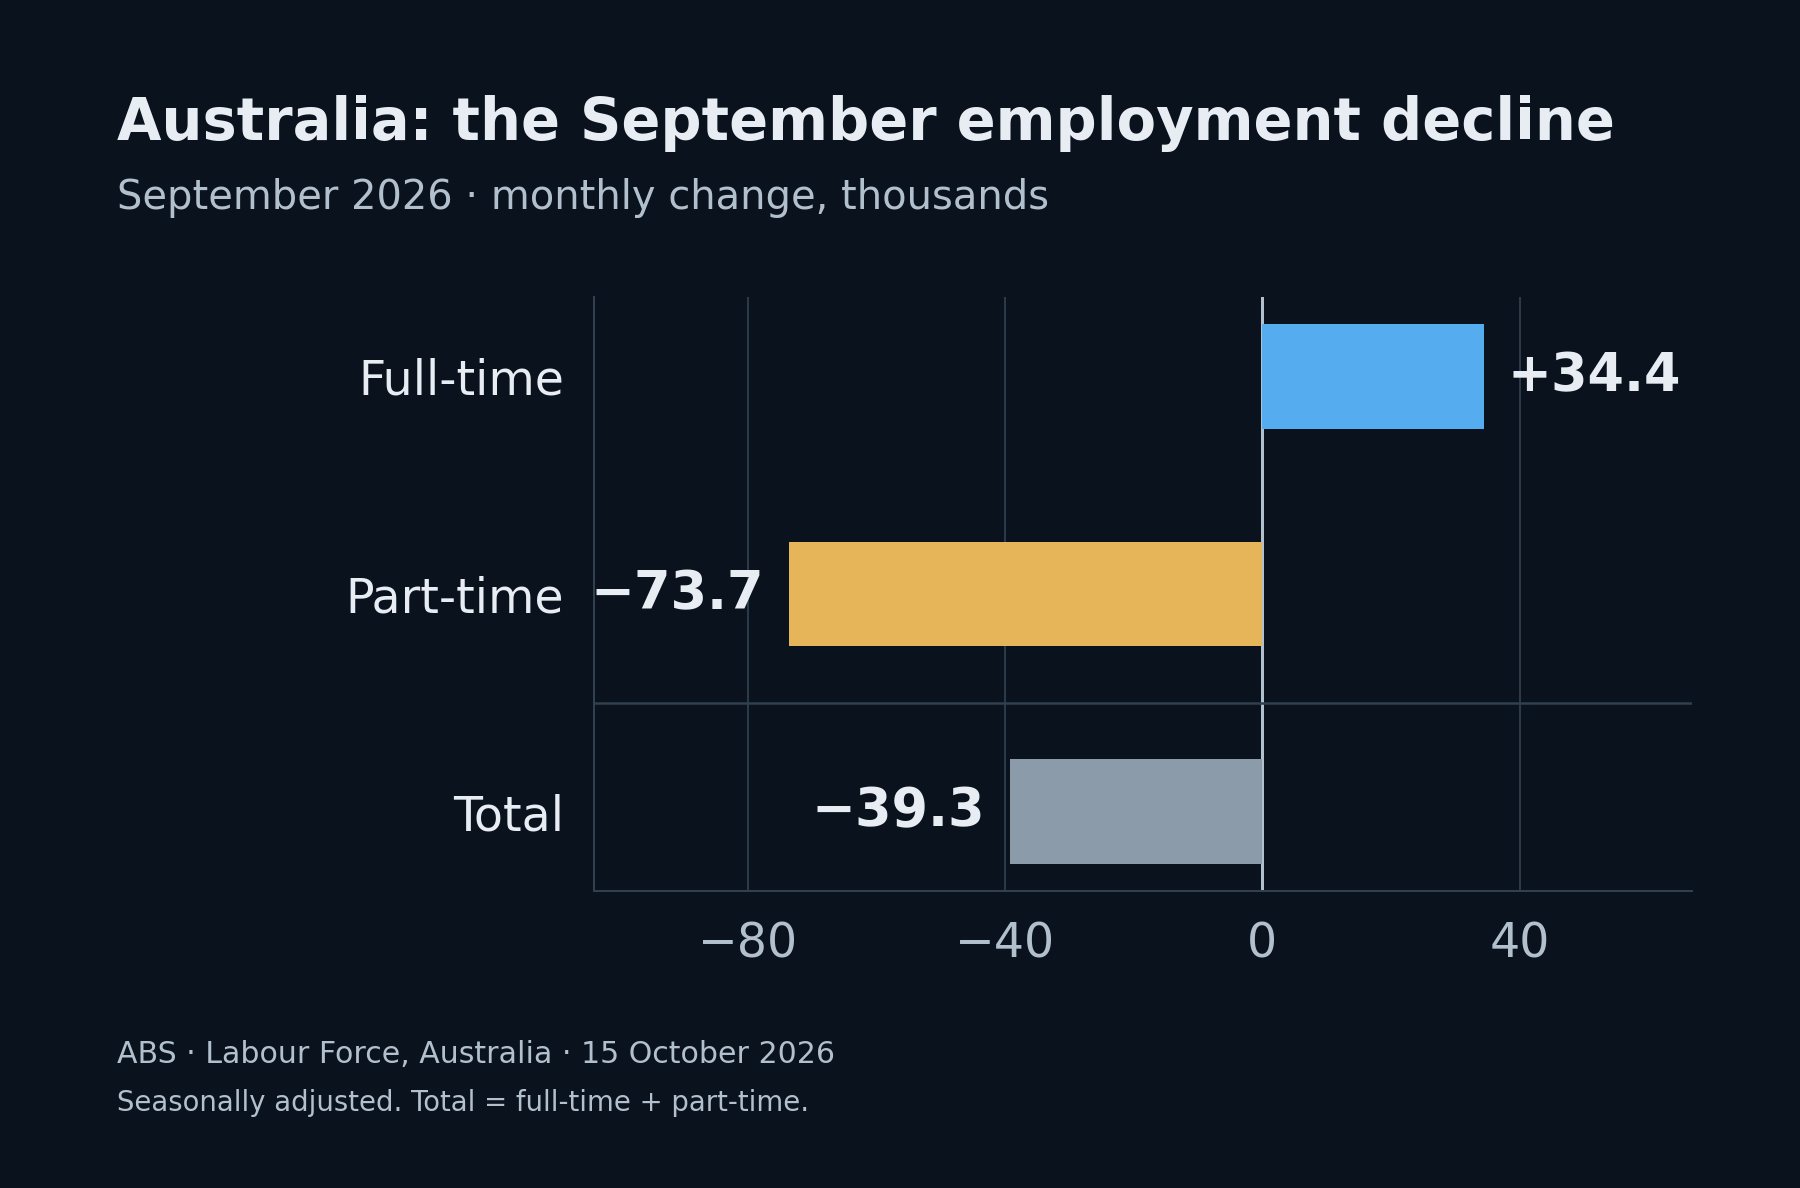
I expect mortgage sensitivity and tighter finance to increase the pressure on domestic demand. Commodity exports and business investment are counterweights. They do not remove the adjustment facing households.
Taken together, these economies face a common shock without identical policy settings. Trade, investment and financial markets connect their responses. A slowdown in one region reduces another region's export demand; a global repricing of risk makes funding more expensive across borders. That is how I expect national spending squeezes to develop into a broader Western recession.
9. Agricultural prices and El Niño form the second potential burden
Food is the most important additional supply risk in this framework because households have limited room to stop consuming it. A second increase in essential spending would arrive after the first energy shock had already reduced their buffers.
The meteorological risk has an identifiable basis. On 3 September, the WMO described an established El Niño expected to intensify into a very strong event. NOAA's 8 October discussion subsequently reported strengthening conditions and a greater than 83% chance of a strong-to-very-strong event continuing through January–March 2027. These are forecasts of the climate state, rather than forecasts that every crop will fail. WMO, September update; NOAA CPC, 8 October ENSO discussion.
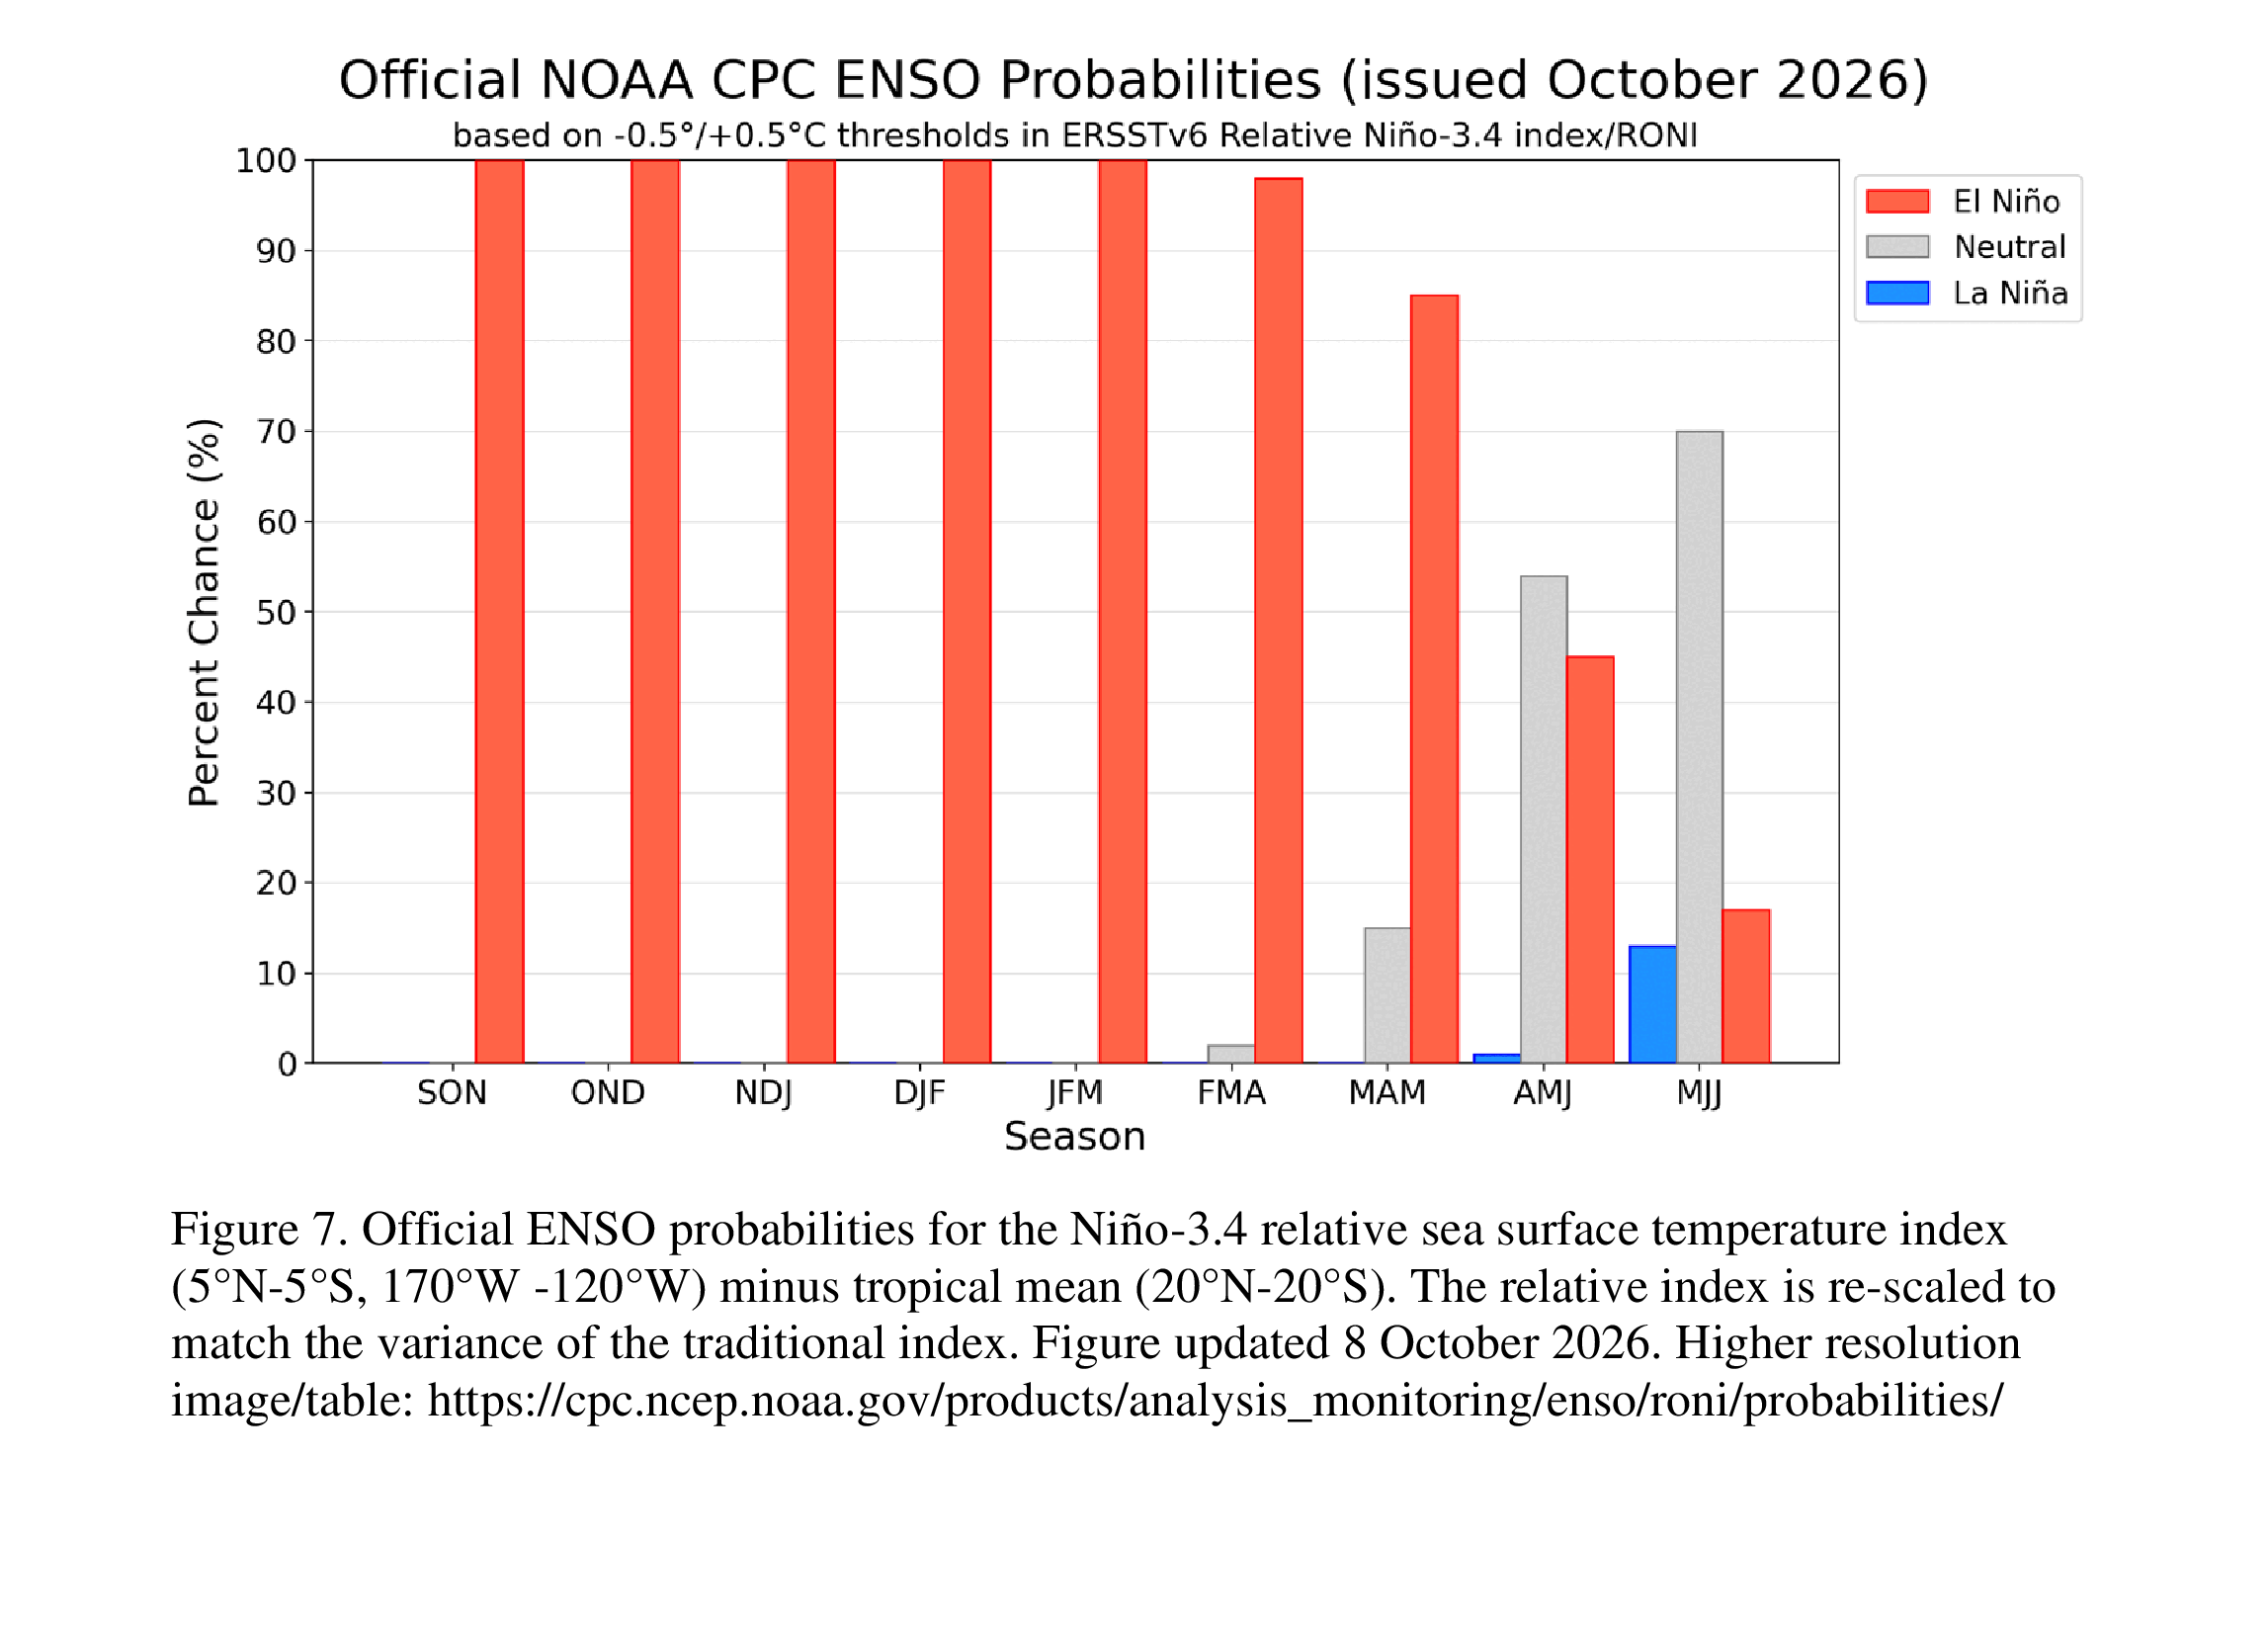
In this figure, SON means September–November 2026, JFM means January–March 2027 and MJJ means May–July 2027. The very high El Niño probabilities into early 2027 explain why weather risk belongs in the economic horizon. They do not identify the size or location of a future crop loss. Source: NOAA CPC, dated October outlook; the local figure preserves the 8 October edition.
The economic path depends on where the weather changes, when it occurs and which crops are exposed. Drought can reduce yields. Excess rain can delay harvesting or damage quality. Water availability can affect processing, irrigation and transport. Those effects differ between producing regions and can partly offset one another.
The price response also depends on stocks, substitution, exports and expectations. A poor harvest can have a limited price effect if inventories are ample. A smaller surprise can have a large effect when buffers are thin. A weather forecast already reflected in prices is different from an unexpected production loss.
My sugar analysis supplies an important timing distinction. Its short thesis covered a one-to-three-month correction window, with positioning and seasonality central to the setup. Its concern about weather and supply extended into the following year. A short-term decline and a later supply-driven price increase are compatible.
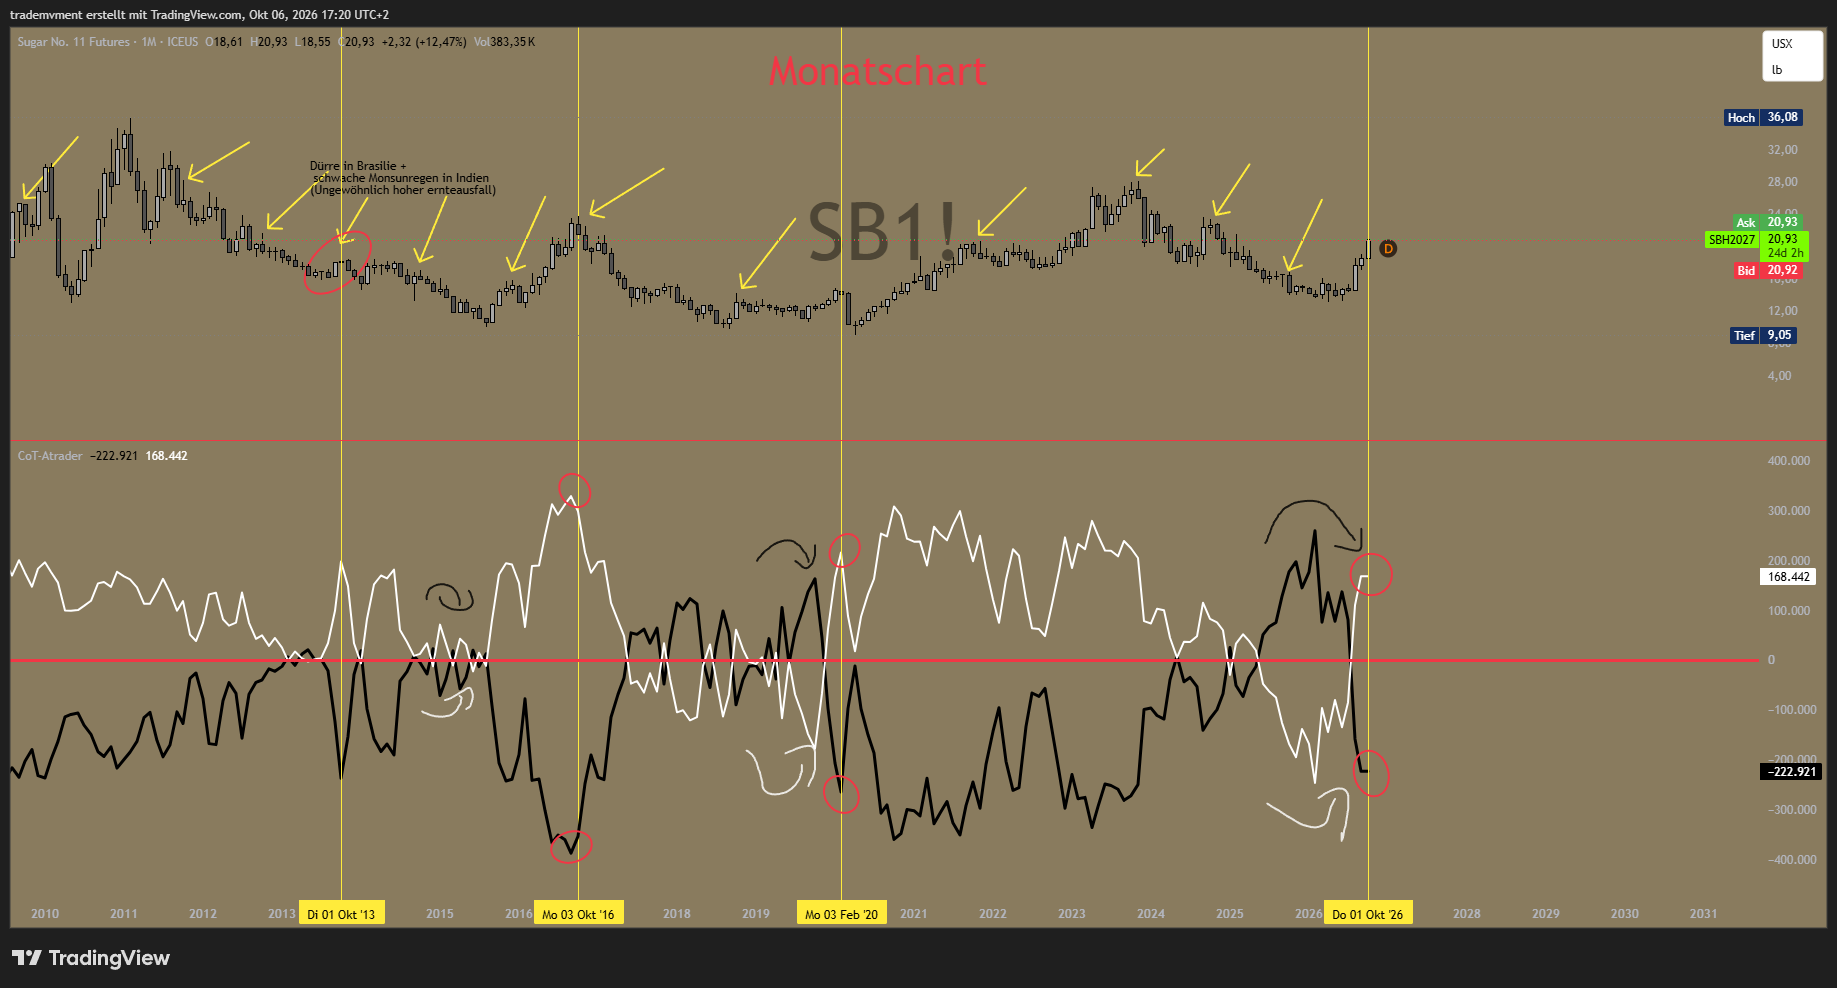
Source: my sugar analysis, 7 October 2026. Commercial hedging and speculative positioning provide market context; they do not establish a future harvest shortfall.
Brazil's sugar–ethanol production choice adds another channel. If weaker oil prices reduce ethanol revenues relative to sugar, flexible mills can favour sugar output. That can pressure sugar prices even while weather concerns remain. The outcome also depends on local fuel pricing, exchange rates, policy and processing constraints. There is no fixed one-for-one relationship between WTI and sugar.
For the wider economy, I am concerned with the combined bill for food, energy and financing. Higher fertiliser, diesel, irrigation and logistics costs can add to the direct effects of poor growing conditions. Food processors, retailers and restaurants must again choose between passing on costs and accepting weaker margins.
El Niño can also affect energy demand and supply across regions. The UK scientific assessment identifies potential pressure on food chains and competition for LNG. This does not establish a cold European winter. Nor does a forecast for the tropical Pacific provide a certain local temperature forecast for Germany or Britain. UK Government, assessment of El Niño impacts.
I treat agricultural disruption as a potential amplifier of the recession and an obstacle to recovery. The existing energy and financing squeeze carries the core forecast. If harvest damage adds a new food-price shock in 2027, I expect weaker real consumption and a harder monetary-policy trade-off than an oil-only analysis would suggest.
10. What the five market analyses say about the sequence
The five publications examine different markets and horizons. Together they form a framework for interpreting the downturn; they are not five independent statistical proofs of a recession.
WTI: supply scarcity first, weaker consumption later
The WTI thesis starts with the economic consequences of high energy prices. I expect those consequences to weaken consumption and eventually put downward pressure on oil. But weaker demand is only one side of the balance. If supply deteriorates faster, oil can remain expensive while activity contracts.
The October IEA report forecasts global oil demand falling by 2.6 million barrels per day on average in 2026, yet still expects a market deficit through year-end. This is the clearest reason to separate my recession forecast from the timing of a bearish oil position. A sustained price decline requires a sufficiently large improvement in the balance between available supply and demand. IEA, October Oil Market Report.
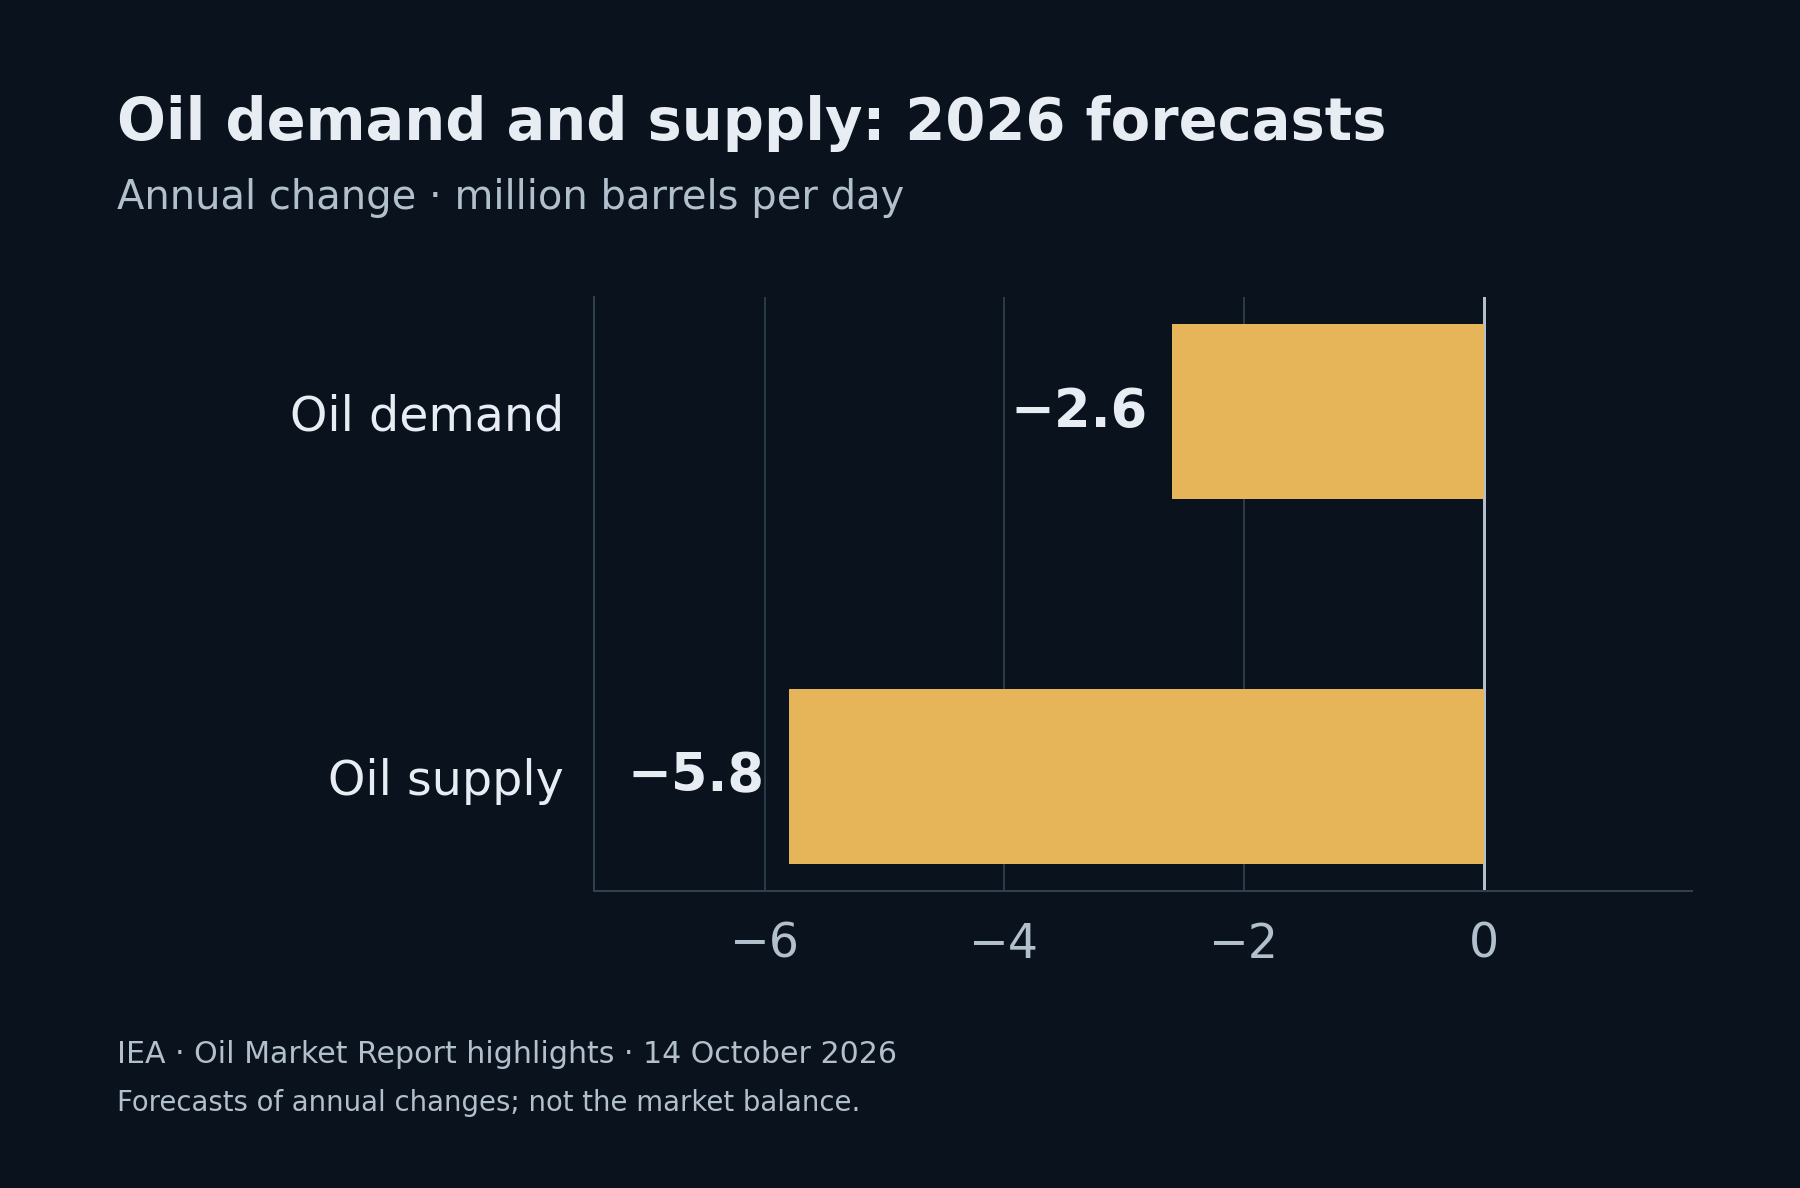
The supply forecast explains why demand destruction and expensive oil can coexist. A larger fall in available supply can keep the market tight despite weaker consumption. The difference between these two annual changes is not itself the market's deficit: the starting balance, inventories and timing also matter. The IEA numbers are forecasts, and they do not by themselves establish the depth of a Western recession.
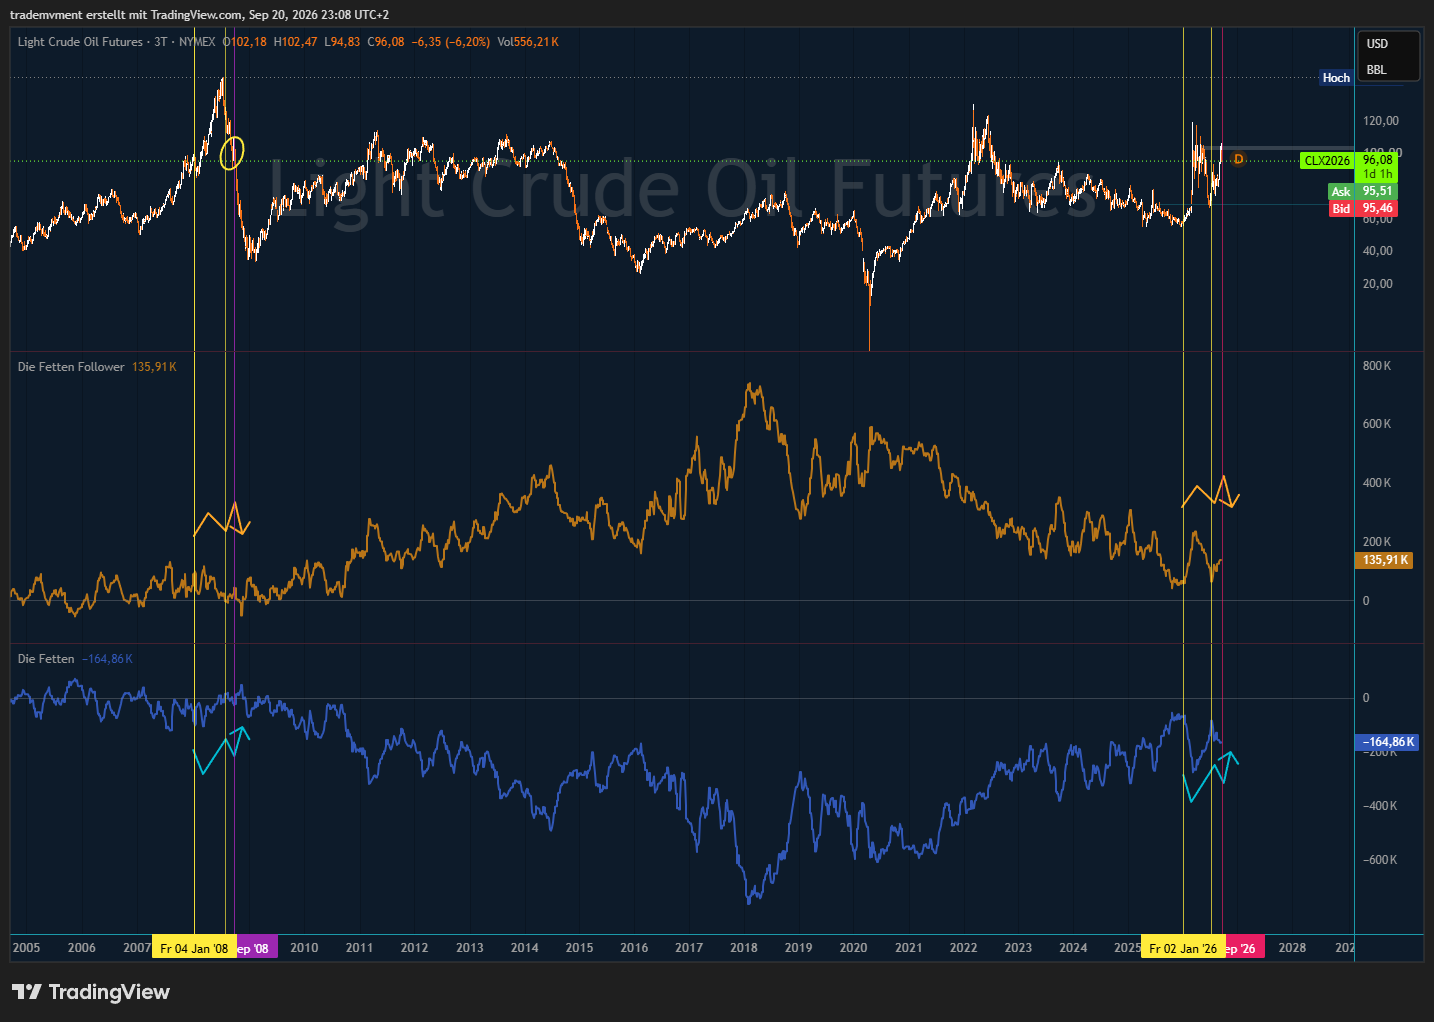
Source: the supplied WTI update, 16 October, which refers back to the full 20 September analysis. The update reports the trade as active. The original chart and its publication date are preserved here.
Natural gas: a winter rally can coexist with a deteriorating economy
My natural-gas publication separates a late-2026 winter trade from a lower potential entry in 2027 and a longer supply cycle. Heating demand, storage withdrawals and production interruptions can dominate for a period even as industrial demand weakens.
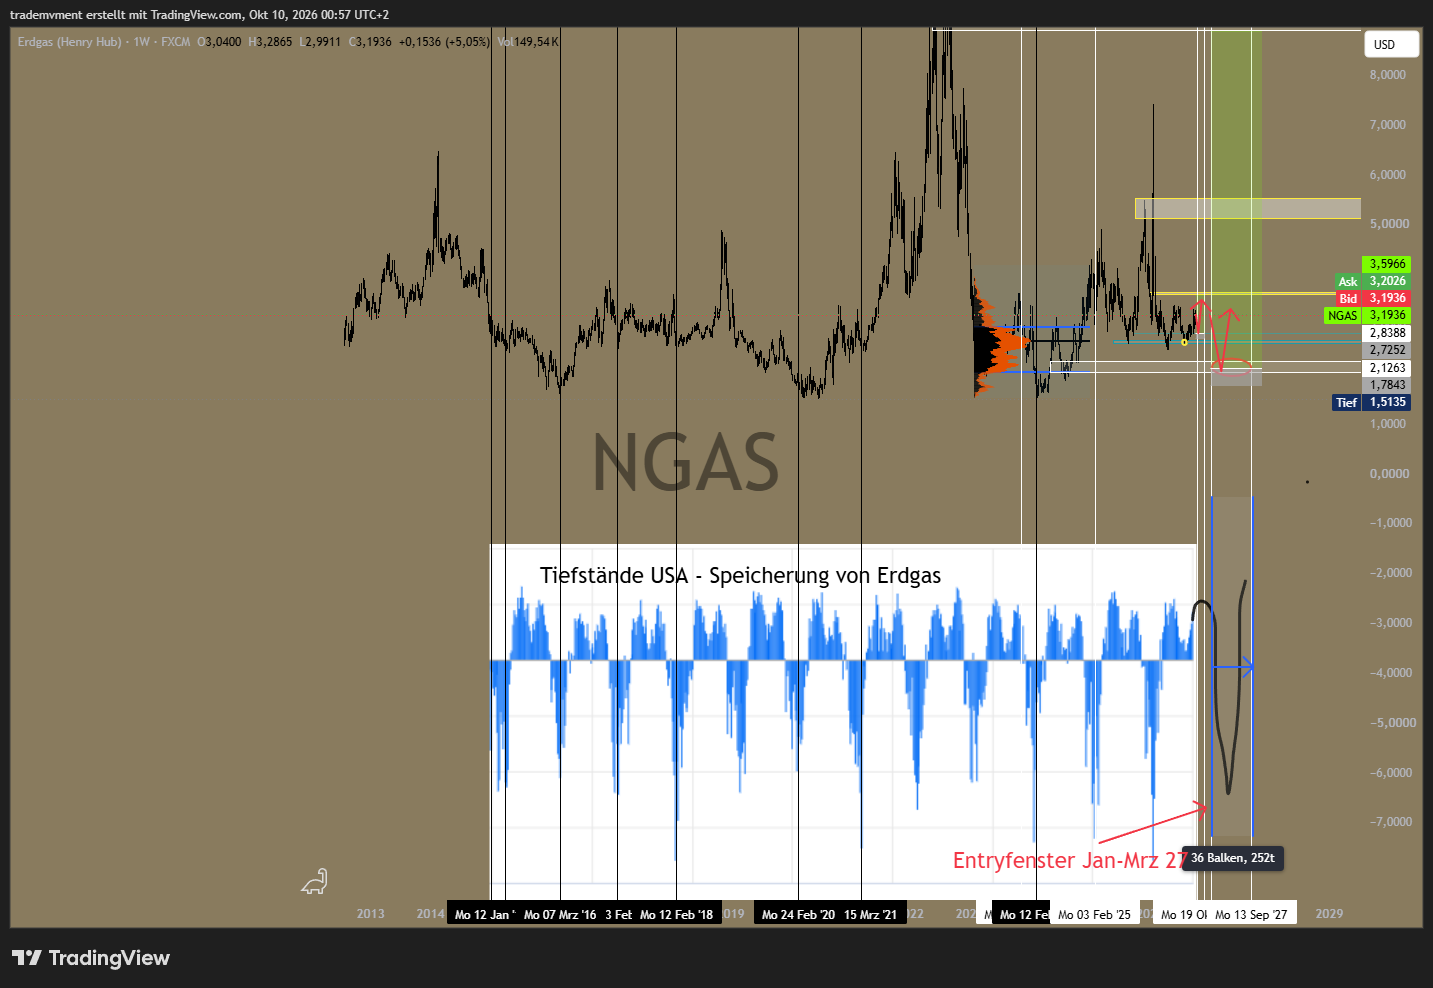
Source: my natural-gas analysis, 9 October 2026.
The instrument also matters. The FXCM NGAS chart and US gas futures do not represent European TTF prices. US production, LNG export capacity, shipping and regional infrastructure affect how shocks pass between those markets. I will not interpret a US gas rally as direct proof of a European shortage.
The larger cycle remains relevant: prolonged low prices can reduce drilling and investment, preparing a later supply response. Recessionary demand weakness and a subsequent energy-price recovery can therefore belong to different phases of the same adjustment.
EUR/CHF: relative European stress and a potential funding unwind
My EUR/CHF short thesis combines European growth exposure with the franc's safe-haven and funding characteristics. I expect pressure on European demand to weigh on the euro relative to the franc during the stress phase.
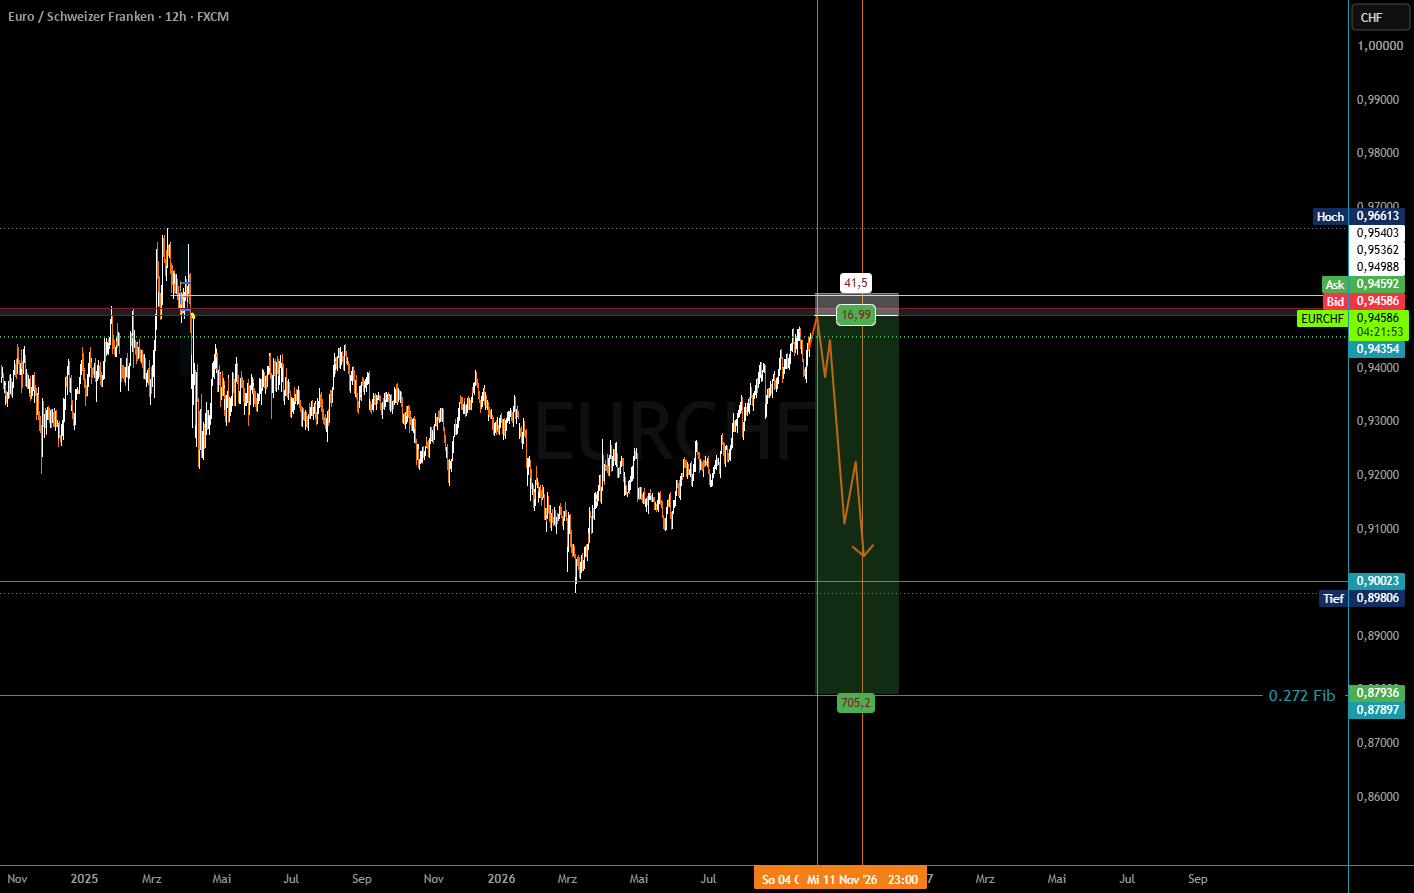
Source: my EUR/CHF analysis, 28 September 2026.
Closing an unhedged franc-funded position can require buying francs to repay the liability. That can amplify appreciation. BIS research documents amplification associated with carry positioning around monetary-policy surprises. Applying it to a wider recessionary risk-off move is an additional interpretation. The charts do not prove a wholesale migration of funding from yen into francs, and SNB intervention remains a material opposing risk. BIS Bulletin 124, May 2026.
GBP/USD: relative policy expectations, rather than British immunity
The GBP/USD long publication looks for an autumn recovery from support, combining seasonality, positioning and a reassessment of the Fed's room to tighten. A pound recovery against the dollar does not require Britain to avoid recession.
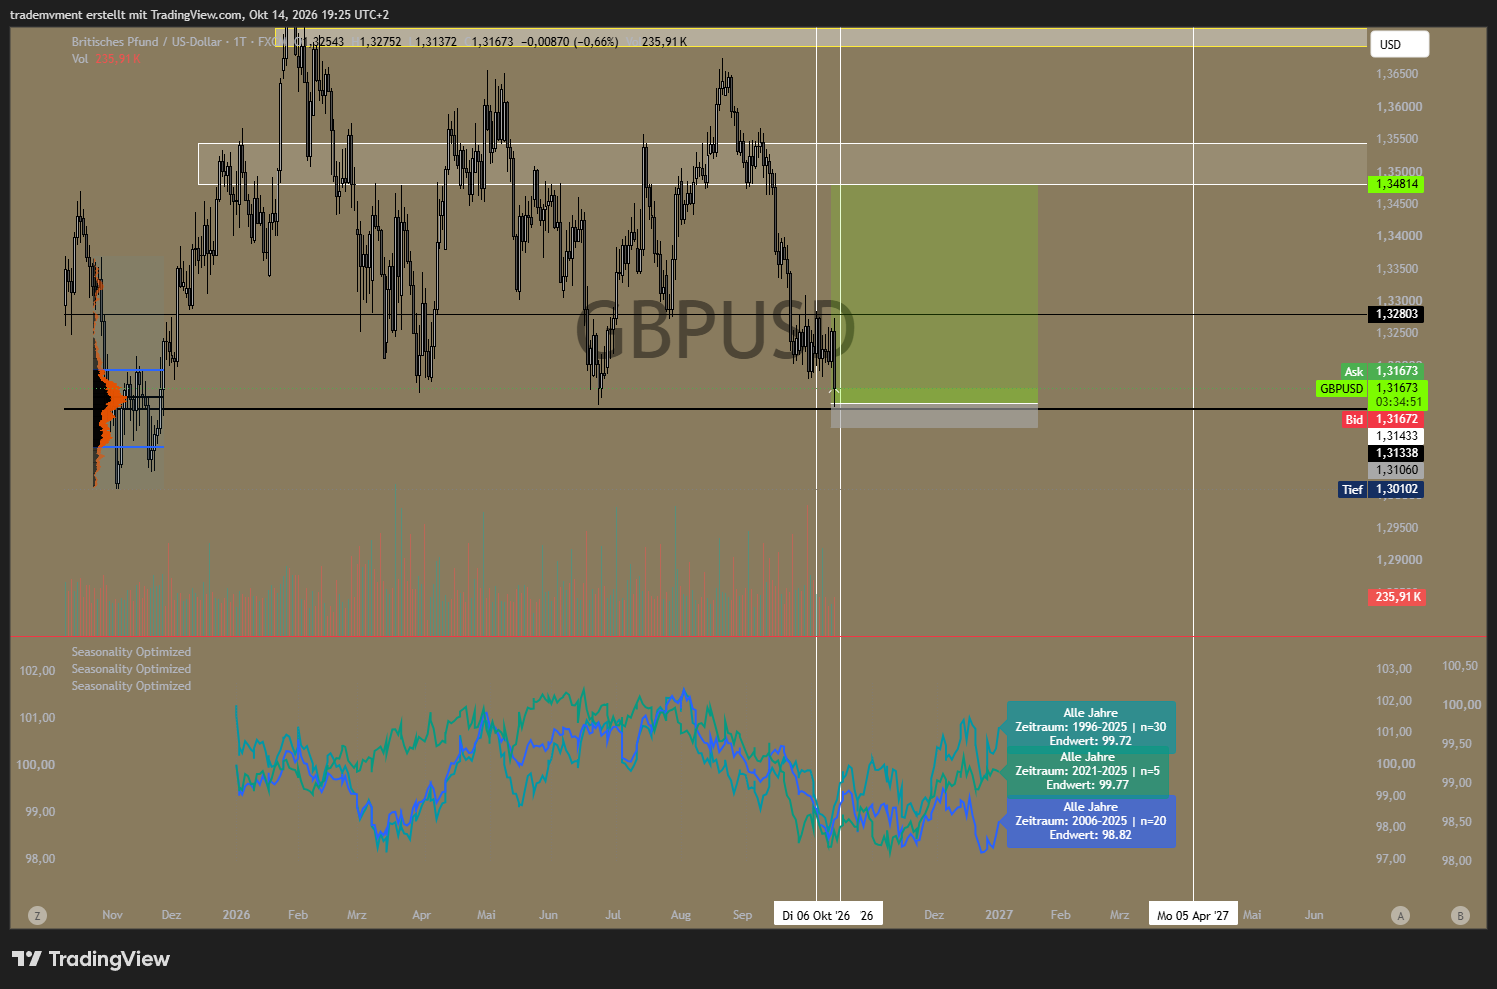
Source: my GBP/USD analysis, 14 October 2026.
The distinction is relative. The pound can rise if expected US returns lose support faster than British returns. Conversely, an acute demand for dollar liquidity can strengthen the dollar during market stress. I expect policy repricing to matter over the cycle, but I do not assume a continuously weaker dollar throughout a Western recession.
Sugar: liquidation and supply stress can occur at different times
The sugar short concerns a nearer-term correction, crowded positioning and the oil–ethanol connection. The later agricultural risk concerns future availability. A broad recession does not require every commodity to fall together: a crop-specific shortage can support food prices while weaker industry and transport weigh on other commodities.
Positioning can accelerate a move when participants reduce exposure, but it cannot identify the whole macroeconomic cause. Commercial shorts often hedge business exposure; Non-Reportables are not a pure census of retail traders. I use those observations to assess vulnerability and execution, rather than to substitute for economic evidence.
11. The sequence I expect from late 2026 into 2027
First: essential costs and financing absorb the buffers. Households protect necessary spending by reducing savings and discretionary purchases. Businesses defend cash flow, pass on costs where possible and become more selective about investment and recruitment.
Next: the adjustment broadens into employment and credit. As weaker orders persist, fewer vacancies and shorter hours give way to more job losses. Income uncertainty restrains spending beyond the households directly affected. Credit quality weakens and financing becomes less available to the borrowers who need it most.
Then: demand weakness changes the inflation and policy balance. Softer volumes and reduced pricing power produce broader disinflation. I expect monetary easing to follow, with the recovery held back by refinancing, impaired cash flow and cautious lenders. Further energy or food disruption would prolong the overlap between weak activity and uncomfortable inflation.
These stages are an expected ordering, not fixed quarterly appointments. They will overlap, and a financial shock could accelerate them. I expect the most important transmission to play out through 2027; I do not derive a precise recession start date from a seasonal chart.
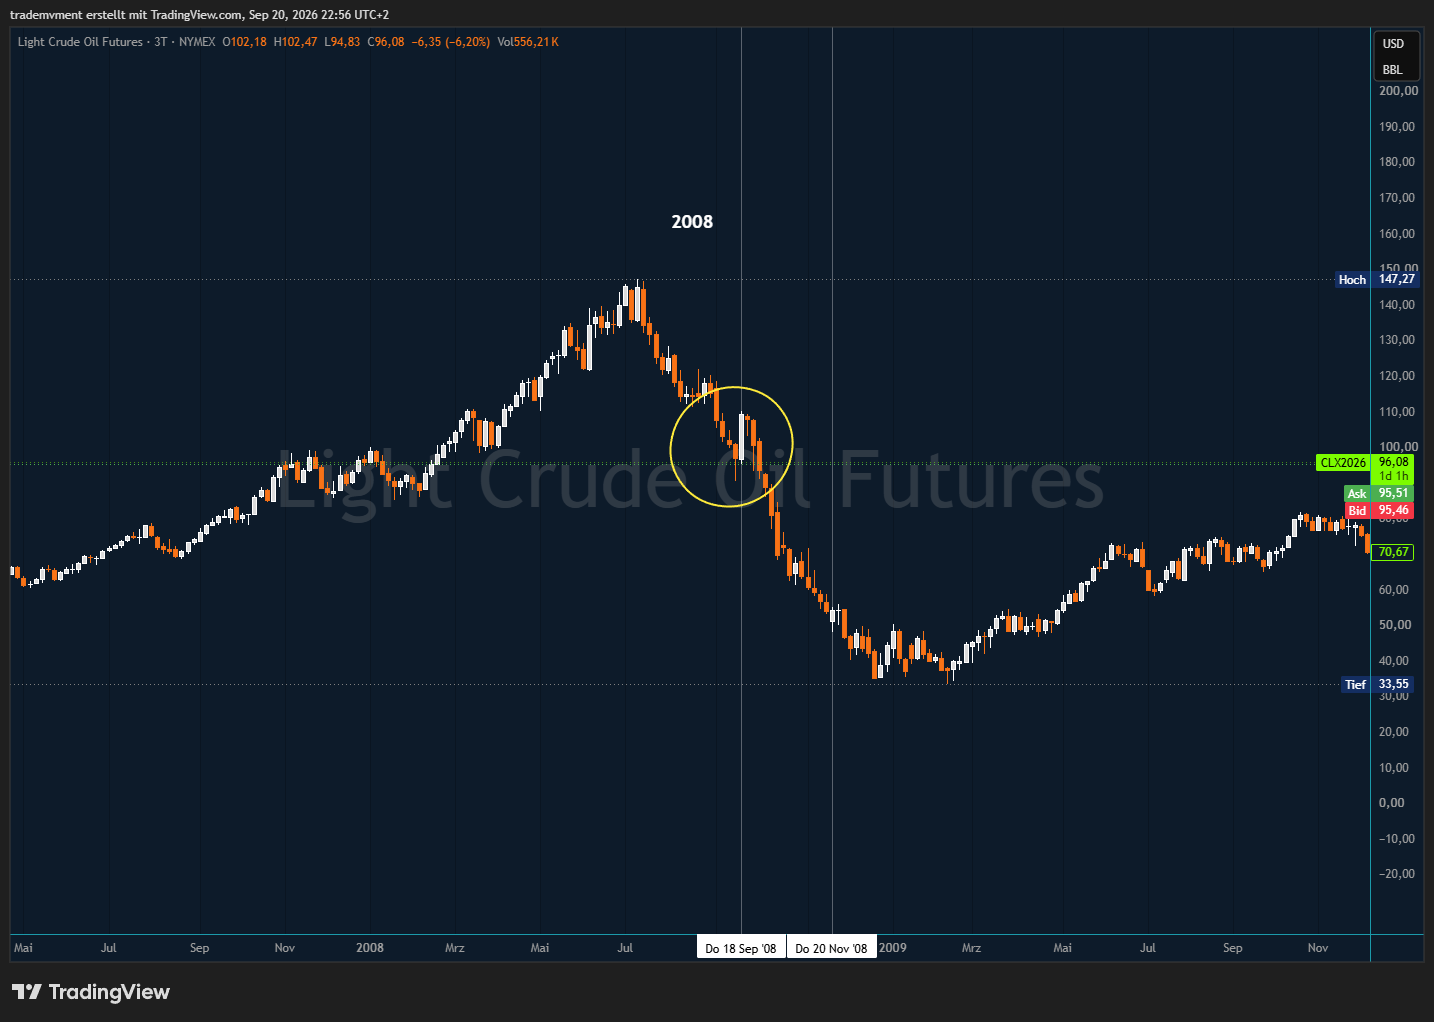
The historical comparisons in my WTI work help identify mechanisms. The early-1980s oil adjustment, the 2001 slowdown, the financial crisis and the pandemic had different causes and policy responses. The pandemic's sudden restrictions on activity are especially unsuitable as a normal template. I expect a broad contraction through budgets and balance sheets; I am not forecasting an exact replay of any one episode.
12. The evidence that will confirm or overturn my forecast
My conviction is about the interaction of the shocks. Energy and food are difficult to substitute away from quickly. Financing passes through with a lag. Firms can protect employment only while their expected revenues and cash flow support it. Once employment weakens, the demand adjustment reinforces itself.
The depth of the recession remains the least directly measurable part of the forecast today. My judgment is that these overlapping mechanisms will produce more than a shallow slowdown. The strongest opposing evidence is the resilience still recorded by policymakers, including US spending and investment and the ECB's positive growth baseline. I expect that resilience to fade; sustained evidence that it is not fading would weaken my case.
I will look for confirmation in:
- Persistent weakness in real retail and consumption volumes, rather than inflation-driven nominal sales.
- Broader declines in new orders, hiring, working hours and private-sector employment across several economies.
- Deteriorating business cash flow, tighter lending conditions and wider credit spreads alongside weaker activity.
- Falling energy use associated with weaker production and transport, distinguished from efficiency gains, substitution or physical supply rationing.
- Later disinflation in a wider range of prices as demand and pricing power weaken.
The forecast would lose its foundation if:
- Energy supply and delivery costs normalise durably before buffers are exhausted, and real household incomes recover.
- Employment, hours and private demand remain resilient through further refinancing, while inflation returns sustainably towards target.
- Productivity, investment or effective fiscal support offset the income loss without renewing inflation or raising funding costs enough to cancel the relief.
- Easier monetary policy passes through to actual credit and spending quickly enough to prevent a broad contraction.
A normalisation of supply accompanied by resilient demand would be a successful adjustment and would contradict my recession call. A lower oil price on its own would not settle the question: it can reflect improved supply or deteriorating demand. The cause determines the interpretation.
My conclusion remains that the West will move from an energy-led inflation shock into broad demand destruction. The loss of purchasing power comes first, the pressure on margins and financing spreads it, and the labour market turns it into a deeper recession. Further war-related disruption and agricultural losses would intensify that process. I expect policy to respond after the contraction has gained momentum, leaving a difficult and uneven recovery through 2027.
13. Source dates and disclosure
This article uses an evidence cutoff of 19 October 2026. Economic releases cover different reference periods; the publication date of a release is not the date on which all its economic effects occurred. Official forecasts are identified as forecasts and remain distinct from my recession judgment. The US three-month payroll average is calculated from the revised July figure of −10,000, August's +133,000 and September's +29,000 in the 2 October BLS release.
The six TradingView charts are my original artwork, reproduced with their original annotations and dates. Eight additional statistical figures were added on 19 October: six charts drawn from published BLS, ECB, Eurostat, ABS and IEA data, plus original figures from Statistics Canada and NOAA. Each carries its source and reference period. The NOAA image was converted losslessly from GIF to PNG; its contents were preserved. Data, observations and forecasts remain identified separately.
All figures are dated snapshots and do not update automatically. The five supplied publications and the fuller WTI analysis linked by the October update are cited beside the relevant discussion. Historical analogies, seasonal patterns and positioning inform my interpretation; they do not constitute independent proof of future economic outcomes. The original text edition is preserved separately; the added statistics illustrate and qualify the transmission channels.
The NOAA ENSO link is a live publication page. The edition reviewed here was issued on 8 October 2026. Later readers may see a newer discussion; its probabilities should not be read back into this article's original evidence cutoff.
Disclosure: My linked 16 October WTI update reports an active short position. The other linked publications contain my directional trade ideas, with their own horizons and invalidation conditions. Those interests are relevant when assessing this research. The article records my personal economic forecast and does not provide individual investment advice.
Loading comments…