S&P 500: A Bear Market in Stages
Horizon: Late 2026 through 2027

Economic research
COT note: The S&P dashboard and the COT overlays use different reports. The overlays’ latest readings match USD Index futures and are read here as a cross-market comparison.
Why a weaker dollar and a recovery in other currencies could come before a deeper equity decline
I expect a bear market in stages. An initial selloff could be sharp, followed by a recovery into Q1–Q2 2027, or potentially Q3. A later, deeper decline could develop more gradually as weaker demand reaches earnings, refinancing and employment.
The timing remains uncertain, but the economic tension is clear. Before the deeper equity adjustment, the dollar could weaken while EUR, CHF, CAD, NZD and AUD recover against it.
Inflation can keep central banks under pressure to tighten even as higher energy costs, borrowing costs and weaker purchasing power erode demand. Equities may first rally on lower inflation expectations or a weaker dollar, then fall as the damage to earnings becomes visible.
1. S&P seasonality: a possible window around 26 October
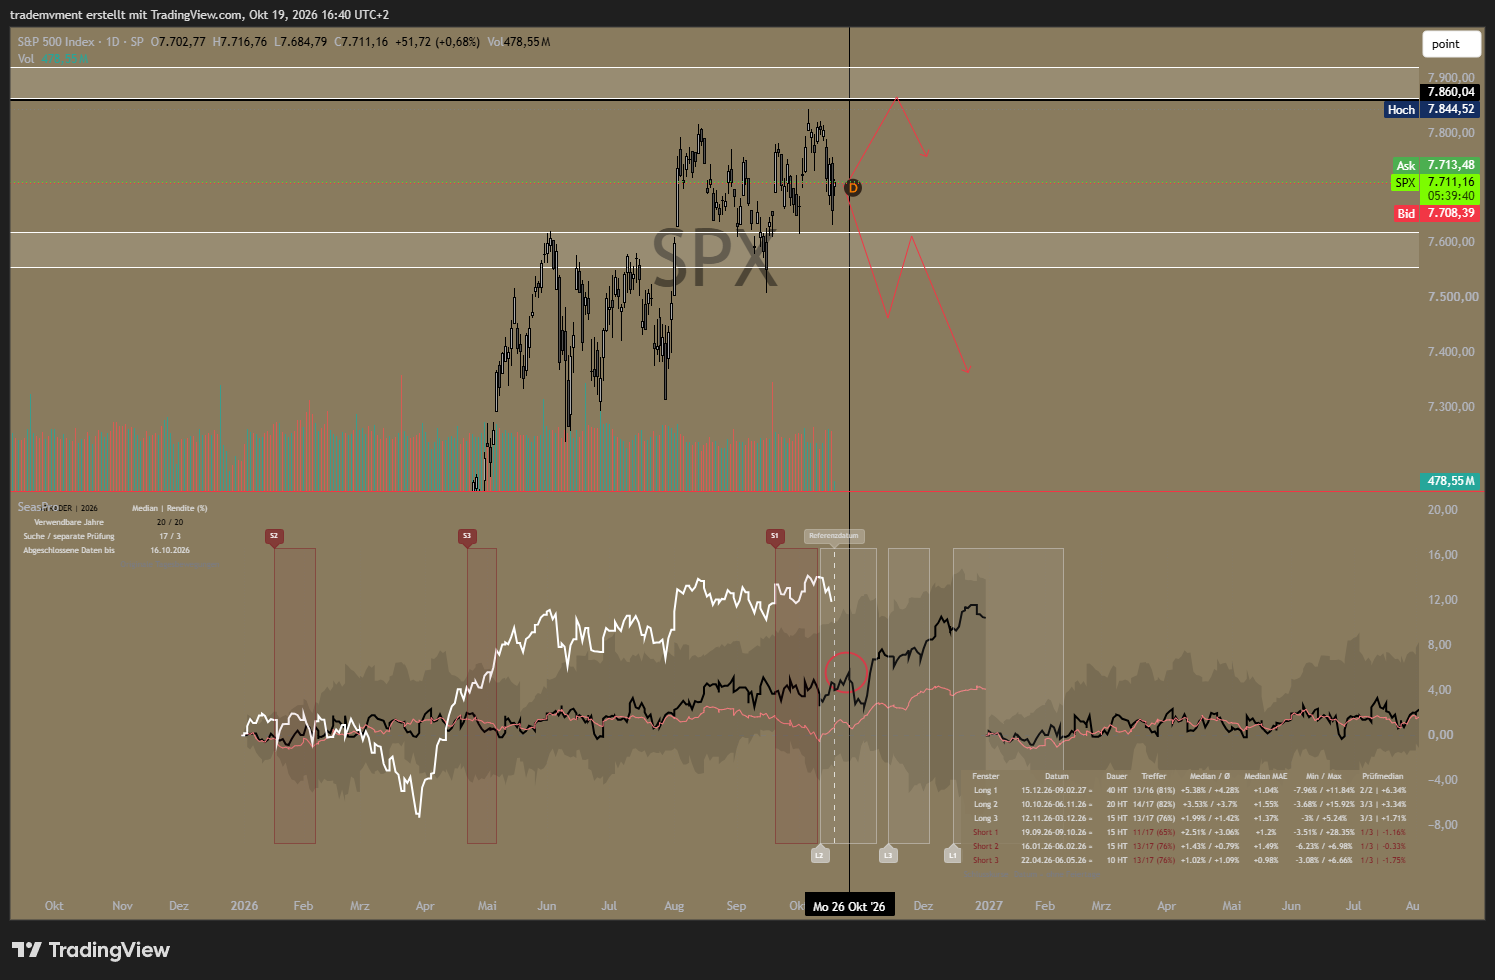
Chart: S&P price structure and seasonality.
In the seasonal median, I see a possible window for a drop around 26 October. The marked dip is the part of this chart I am watching most closely in the near term.
The broader seasonal path turns strongly bullish afterwards. I am not adopting that path as my main outlook because inflation, renewed tightening and the risk of demand destruction leave me more cautious about equities.
The price chart allows for a final rebound into resistance or an earlier breakdown followed by a failed recovery. Both fit my view of a market becoming more vulnerable near its highs.
A recovery can still occur within that broader bearish sequence. My focus is on whether it holds, or whether selling pressure returns as the macroeconomic strain reaches earnings.
2. COT: large speculators short, smaller participants still long
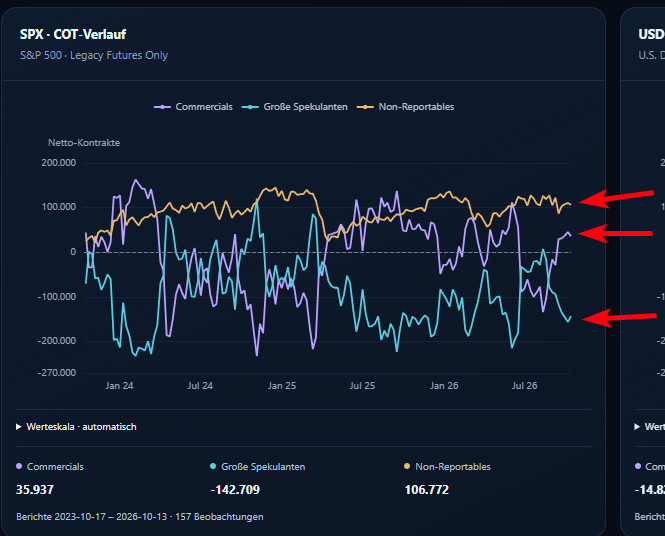
The large speculators stand out on the short side. At the same time, non-reportables have retained a high long bias over recent months. I do not see a broad unwinding of that exposure in the chart.
Commercials are positioned on the opposite side to the large speculators, but their long bias looks relatively muted against their own earlier peaks. That difference in the strength of the positioning swings is what interests me.
My reading is that the groups are expressing very different expectations. Smaller participants remain heavily exposed to further upside while large speculators lean the other way. If the index loses support, that remaining long exposure could add to selling pressure.
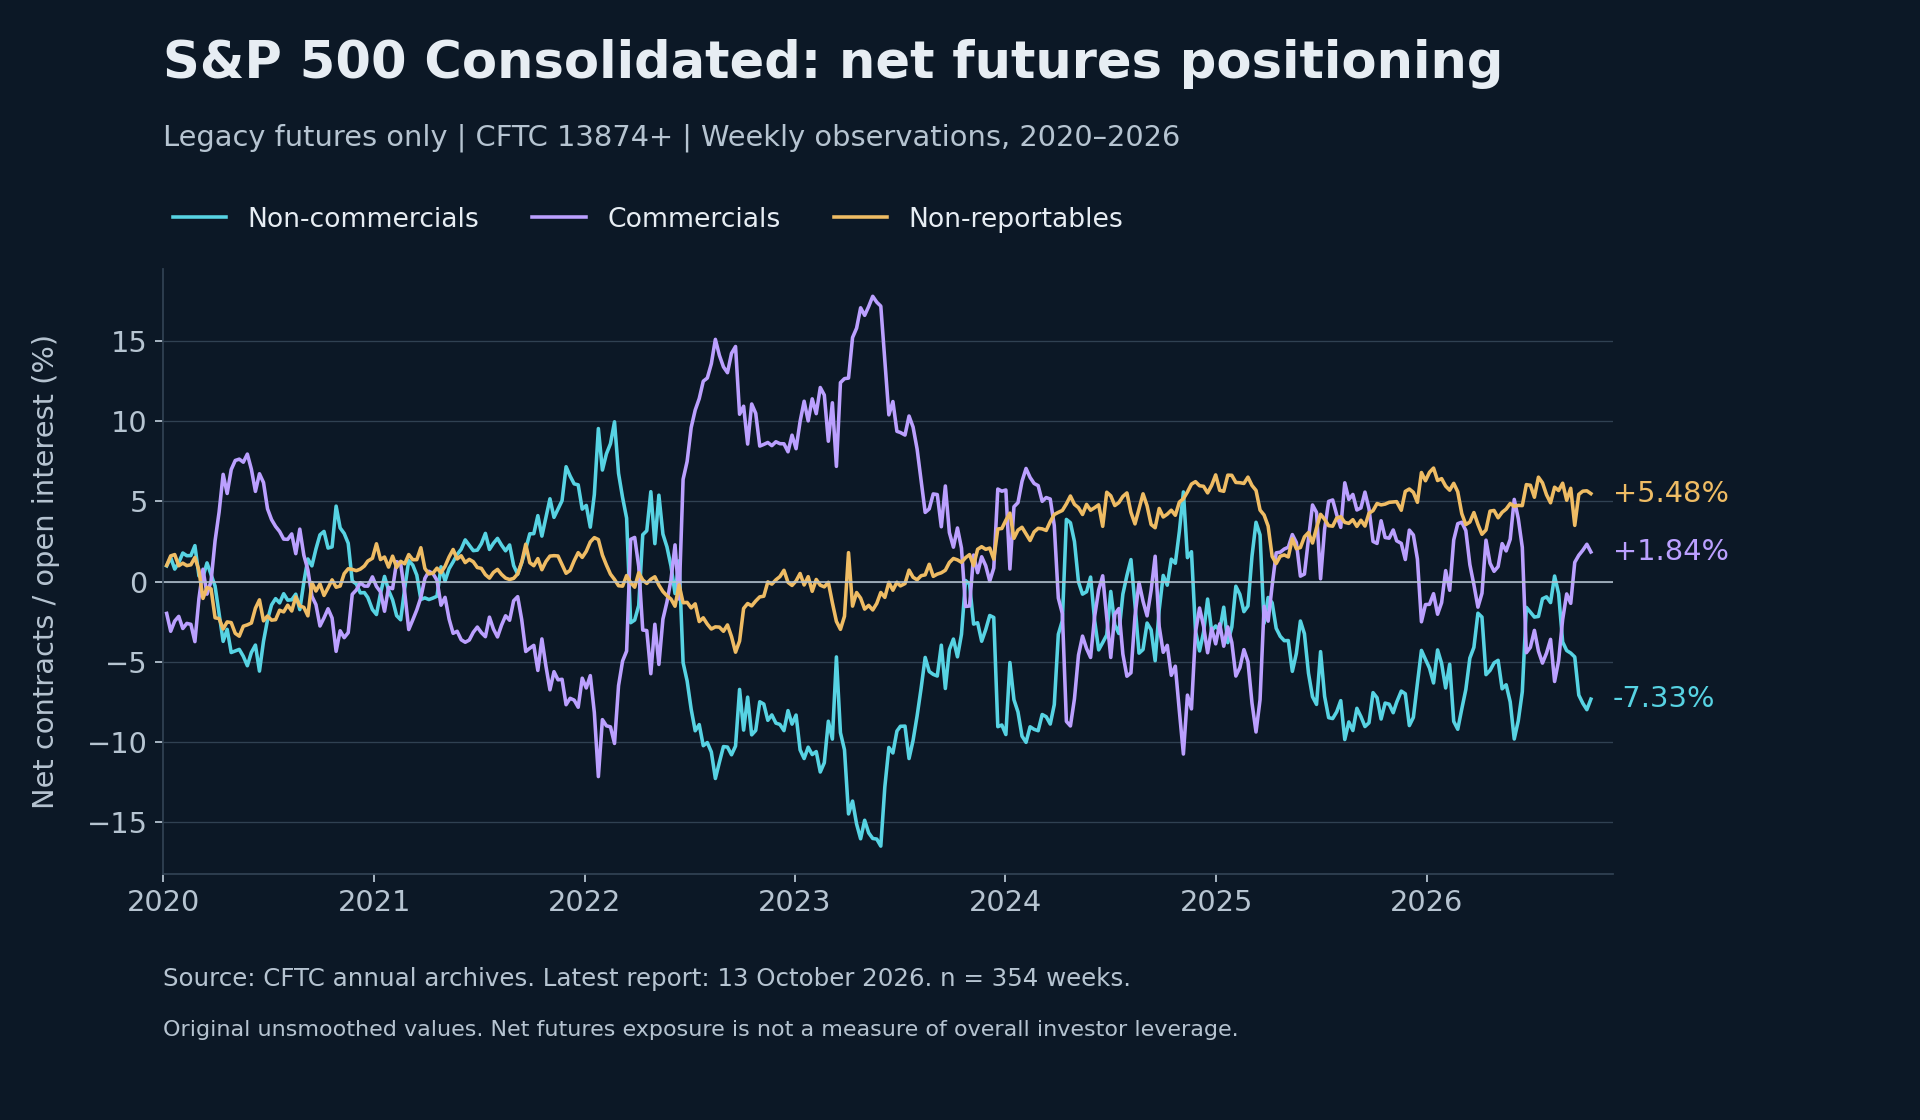
The longer view shows how persistent the smaller-participant long bias has become. I am watching how that exposure responds if price starts to weaken.
The positioning shift and the comparison with 2020–2022
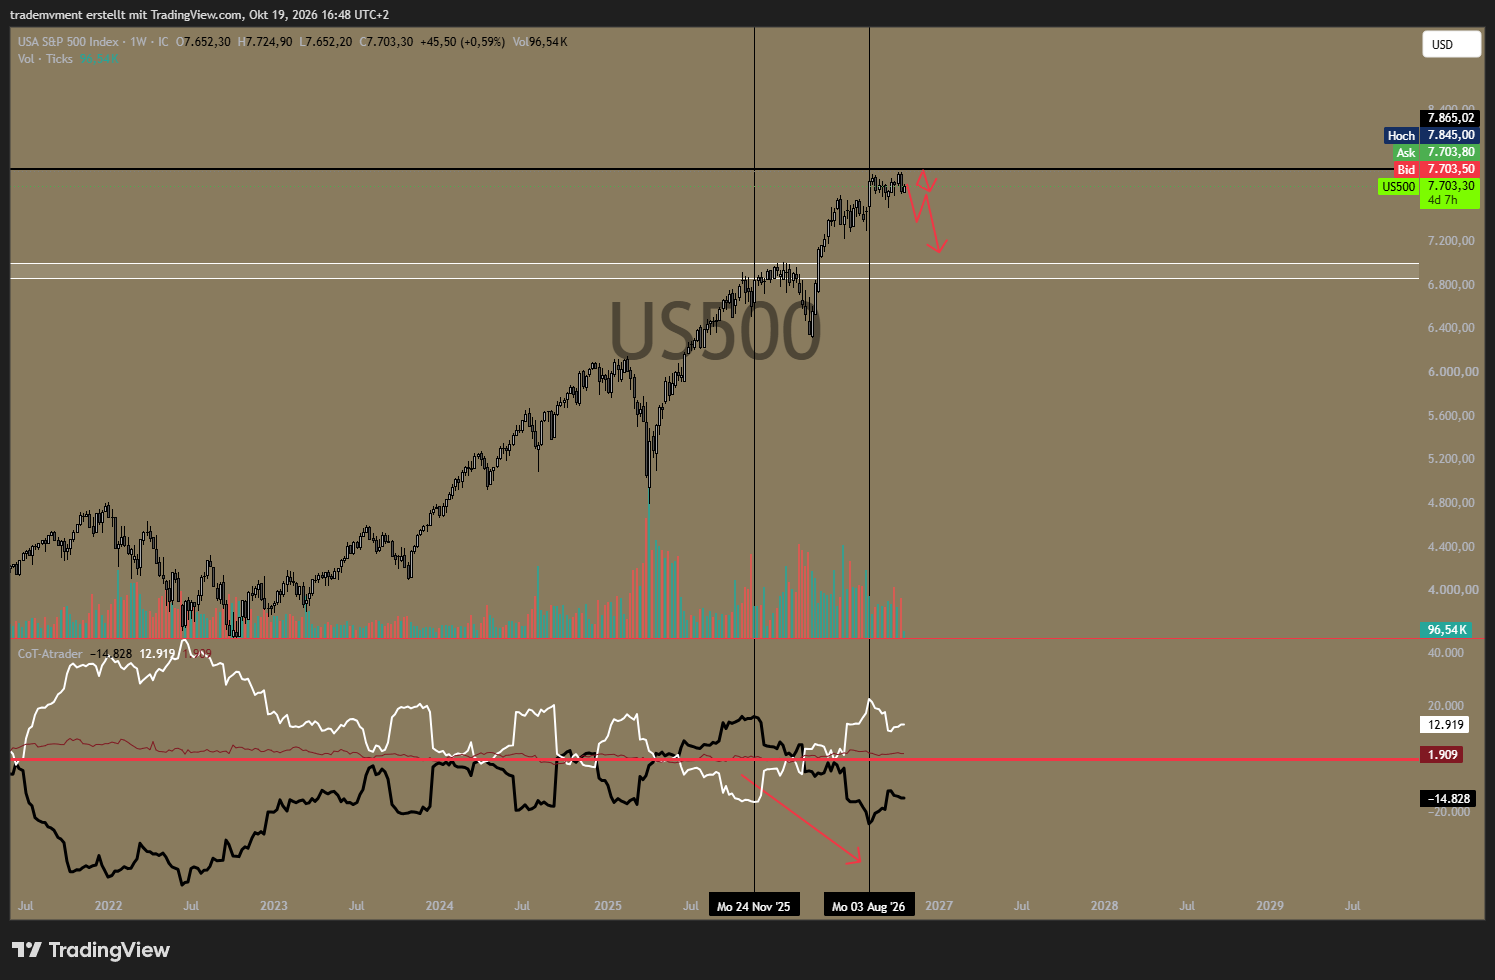
Chart: S&P with COT comparison.
In this first comparison, I focus on the commercial line. Since November 2025, it has moved from a pronounced long position to a pronounced short position in the COT series shown below the S&P. The index has remained near its highs while that positioning balance has changed substantially.
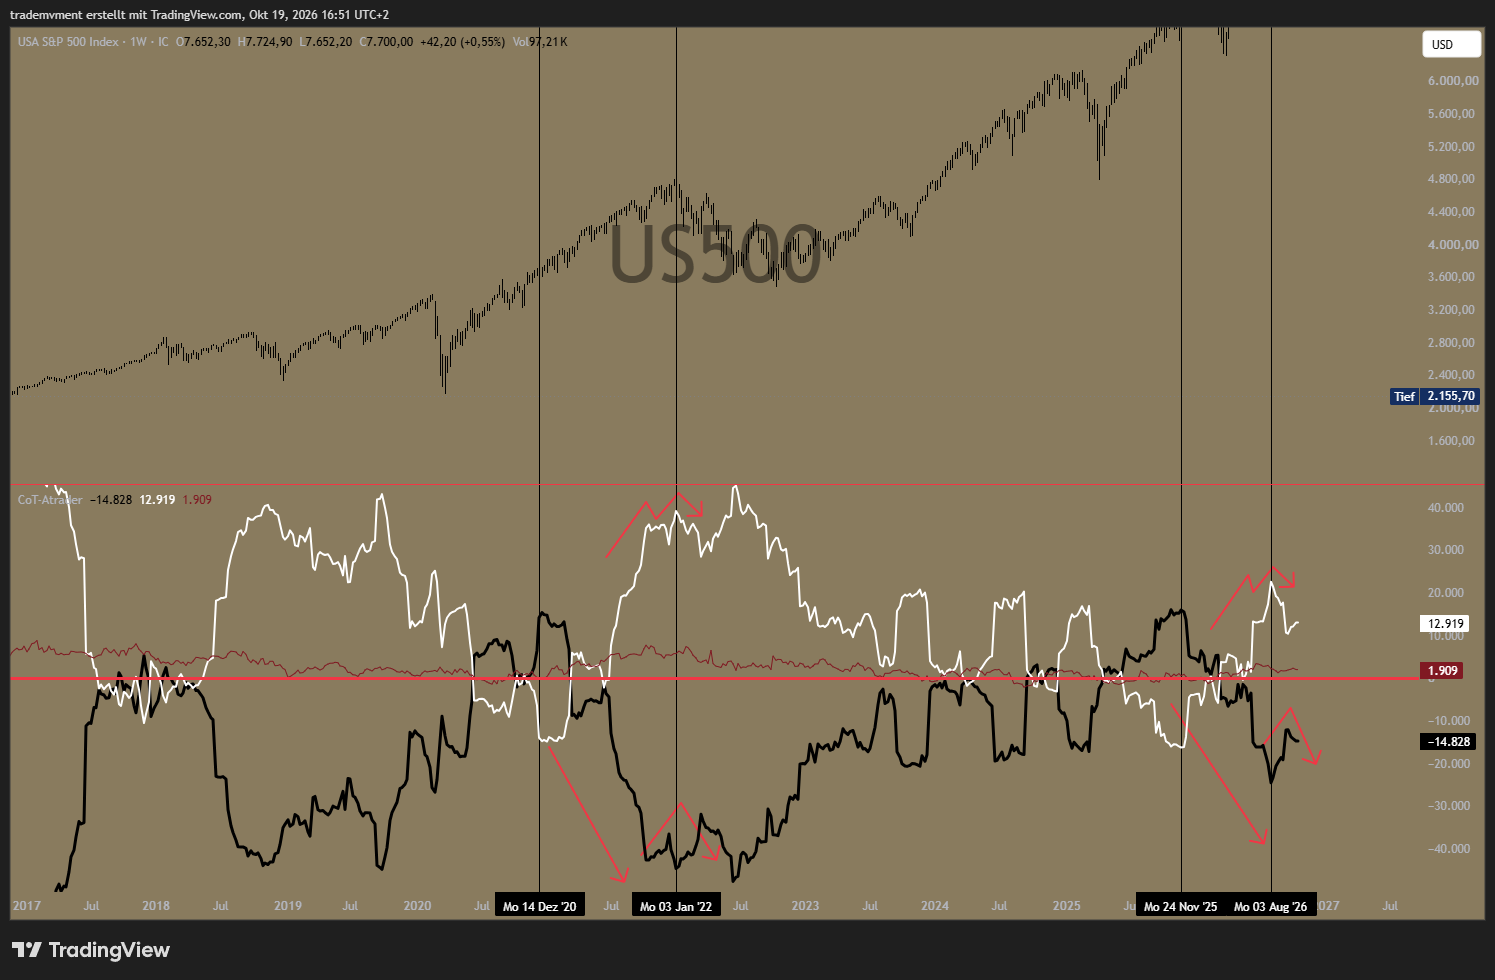
Chart: Historical behaviour comparison.
The 2020–2022 comparison highlights a similar change in direction: commercials moved further onto the short side while large speculators built the opposing position. I am comparing the behaviour of the groups around a changing market environment.
That shift fits my concern about a more vulnerable equity market. A sharp first decline, a recovery and a later deterioration would allow positioning pressure and weaker earnings to affect prices at different stages.
3. Inflation and activity: the uncomfortable overlap
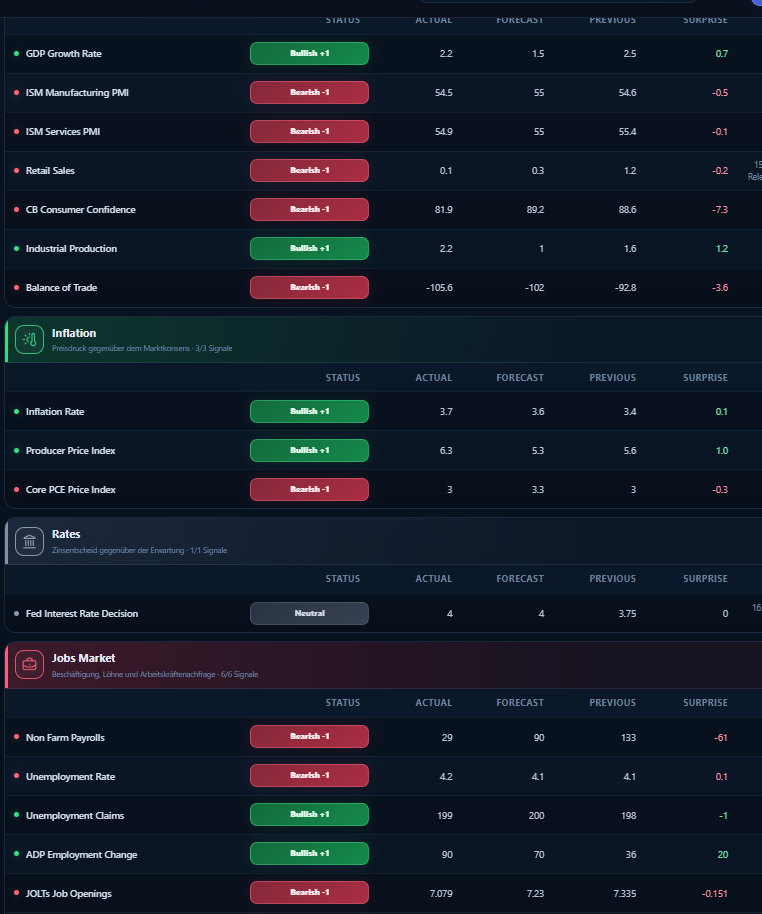
The dashboard shows weaker-than-expected activity alongside upside inflation surprises. That combination leaves central banks less room to support demand.
The labour-market picture is softening. Weak hiring and downward revisions suggest that companies are becoming more cautious, adding to my concern about demand. BLS September employment release, published 2 October.
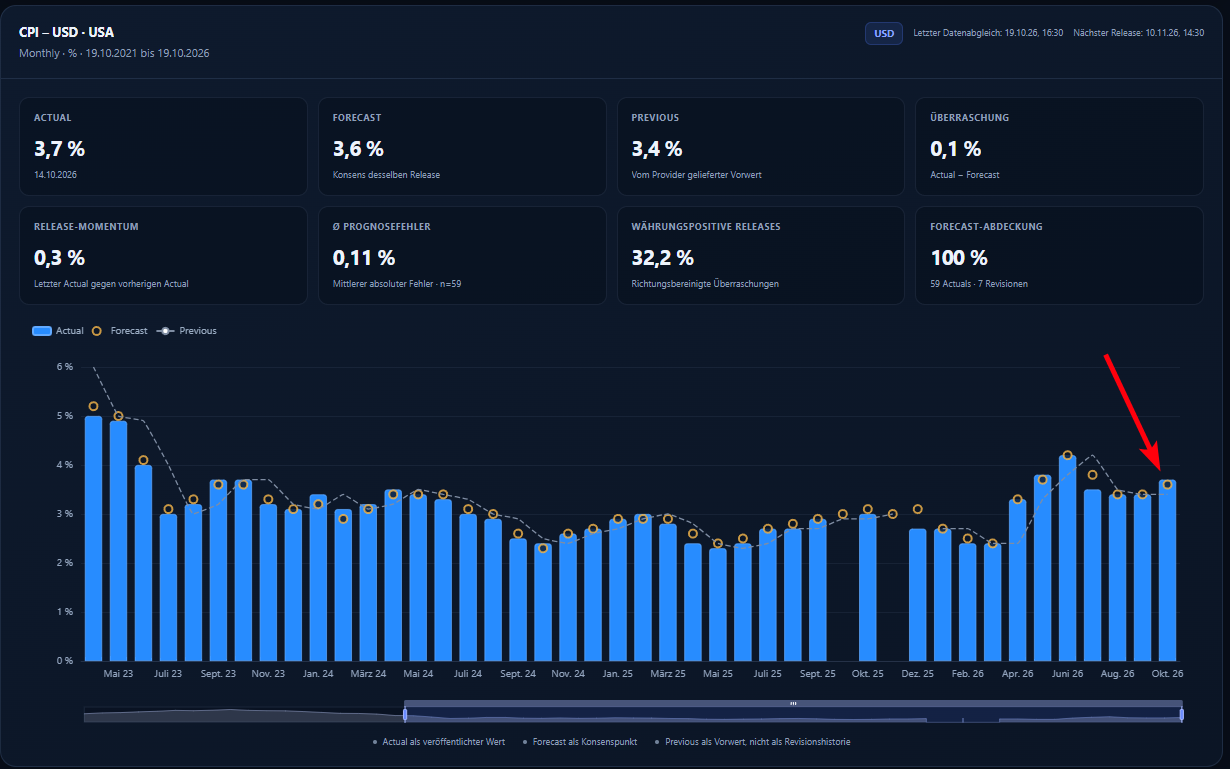
Headline CPI has risen again, reaching 3.7% year on year. Inflation remains uncomfortable even as parts of the economy lose momentum. BLS September CPI release.
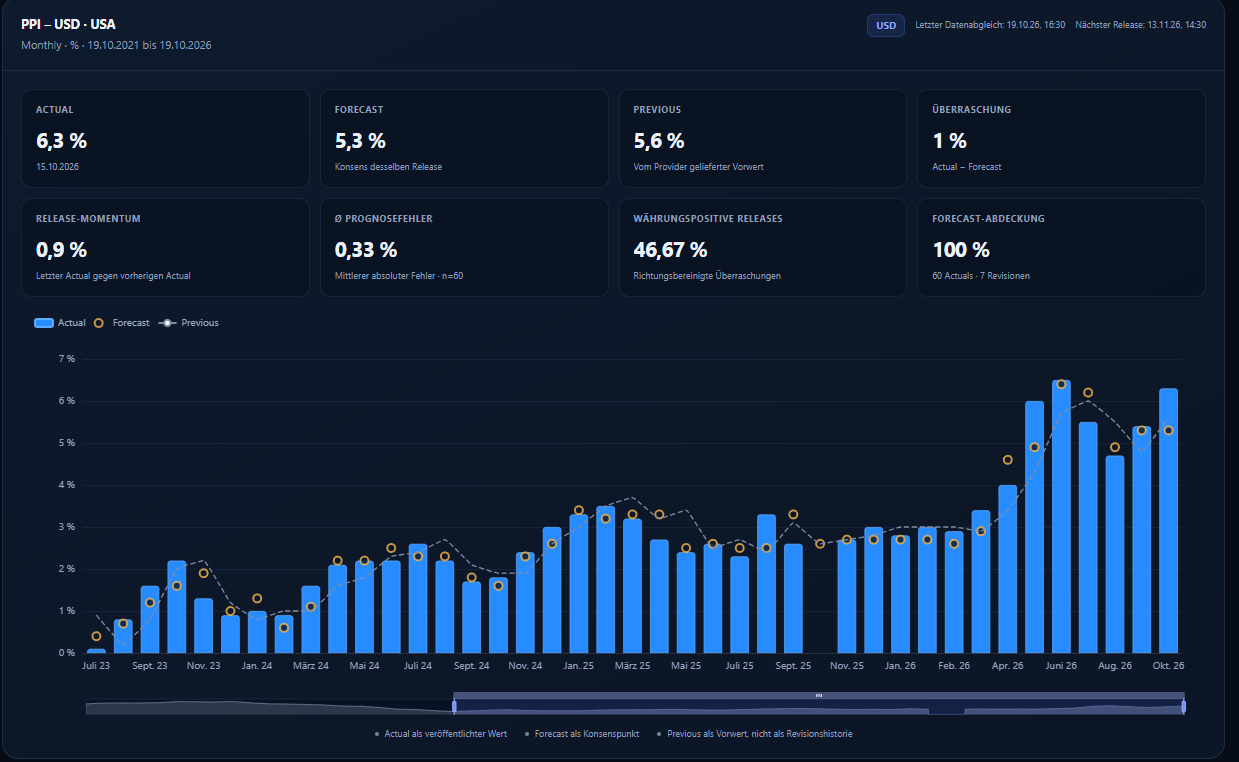
Producer prices are also under pressure, with PPI at 6.3% year on year. Higher input costs can squeeze companies that are already finding it harder to pass increases on to customers. BLS September PPI release, published 15 October.
My concern is the transmission from this overlap into profits. If companies face higher input and financing costs while customers become more price-sensitive, passing through every increase becomes harder. Some firms protect margins by reducing hours, hiring, inventory or investment. Households faced with higher essential spending have less capacity for discretionary purchases. The resulting demand weakness can arrive after the initial inflation shock.
I expect this pressure to show up increasingly in margins, hiring and company guidance.
4. Central banks: renewed tightening across several important economies
A substantial group of major central banks is again responding to inflation with higher policy rates or an unwillingness to ease. The decisions are not uniform:
| Central bank | Latest reviewed decision | Implication for this thesis |
|---|---|---|
| Federal Reserve, 16 September | Raised the target range to 3.75–4.00% | Inflation has already prompted renewed US tightening. |
| ECB, 10 September | Raised rates by 25 bp; deposit rate 2.50% | The euro area also faces renewed tightening. |
| RBA, 29 September | Raised the cash rate to 4.60% | Australia's inflation problem still dominates the decision. |
| RBNZ, 2 September | Raised the OCR to 2.75% | New Zealand is also removing stimulus. |
| Bank of England, September | Held at 3.75%; three of nine members preferred a hike | Inflation concerns exist without a majority decision to hike. |
| Bank of Canada, 2 September | Held at 2.25% | CAD can recover through a weaker dollar and relative policy expectations. |
| SNB, 24 September | Held at 0% | Low CHF funding costs are relevant to the carry-unwind scenario. |
Sources: Federal Reserve, ECB, RBA, RBNZ, Bank of England, Bank of Canada and SNB.
Several central banks are raising rates again. Higher rates make borrowing more expensive and leave people and businesses with less money to spend or invest.
The effects take time. Some people and businesses feel higher borrowing costs straight away; others feel them when they need a new loan. Even if central banks stop raising rates, borrowing can remain expensive.
This is one reason I expect the market to fall in stages. Share prices may react first to higher rates. Later, weaker spending could put more pressure on company profits.
5. The Fed, Waller and the lesson of the early 1980s
Waller's focus on restoring price stability reinforces my view that further Fed tightening remains possible.
Waller supported September's hike and continued to emphasise inflation risks. His stance leaves room for further tightening if price pressure persists. Waller's 8 October speech.
This is why I still allow for another Fed hike despite the risk of weaker demand. The economic damage from restrictive policy can become clearer after the decision to tighten.
The early 1980s show how difficult it can be to bring persistent inflation under control. I expect that experience to make policymakers cautious about easing too soon, even if activity starts to weaken. Federal Reserve History: The Great Inflation.
The market implication is a possible delay between weaker activity and convincing policy relief. Equities could rally on the expectation of lower rates, only to find that persistent inflation prevents the scale or speed of easing they had assumed. Conversely, durable disinflation with resilient activity would undermine this part of my bearish case.
6. Demand destruction: connecting oil to the S&P
This outlook extends the framework in The West Is Heading for Demand Destruction and my WTI macro swing analysis. The initial shock is a rise in essential costs. The later risk is that those costs, compounded by restrictive financing, weaken consumption and investment.
Higher input costs put pressure on margins. Higher essential spending leaves households with less room for discretionary purchases. Restrictive financing makes investment and refinancing harder. Together, these forces can weaken both sales and profits.
Falling commodity prices later in the process would not automatically mean the macro risk had disappeared. If prices fall because supply normalises, households and firms receive useful relief. That can be bullish for equities. If prices fall because orders, transport demand and construction activity deteriorate, lower input costs can arrive alongside weaker revenue. The same price decline can therefore represent very different conditions for earnings.
The IEA expects weaker global oil demand this year while still seeing a tight supply balance. Expensive oil and weakening demand can therefore coexist, prolonging the pressure on consumers and businesses. IEA Oil Market Report, October 2026.
Large, well-funded companies may hold up longer than more exposed borrowers. That could keep the S&P firm even while weakness spreads beneath the surface.
7. Why the dollar can weaken even if the Fed hikes again
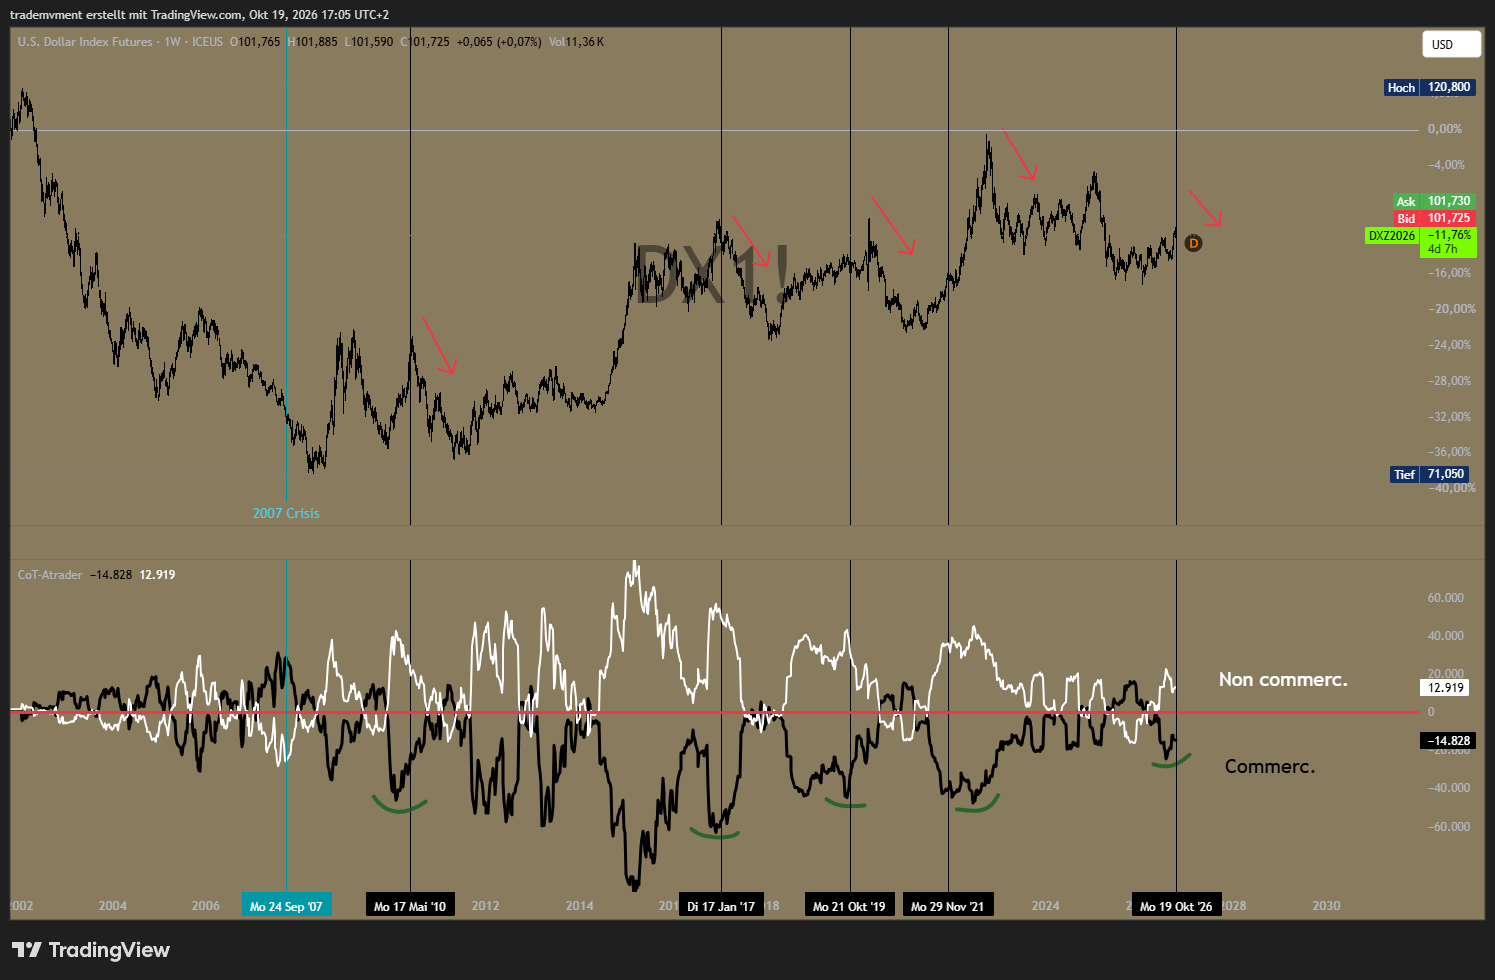
Original: Dollar selloff and COT comparison.
An exchange rate compares two sides. A US rate increase does not guarantee dollar appreciation if it is already expected, if the expected future US path becomes less restrictive than previously priced, or if other economies' expected interest rates rise more. Growth expectations, hedging and position changes can also dominate a particular period.
That leaves room for my short-term dollar decline within a broader outlook that still allows another Fed hike. The dollar could fall while the Fed hikes if the market's relative reassessment favours other currencies. Alternatively, a recovery could occur in some dollar pairs without a large move in the dollar index.
In the dollar chart, commercials lean short while large speculators remain long. The earlier comparisons show why I am watching for a reversal and a reduction in speculative dollar exposure. CFTC ICE Legacy futures-only report, 13 October.
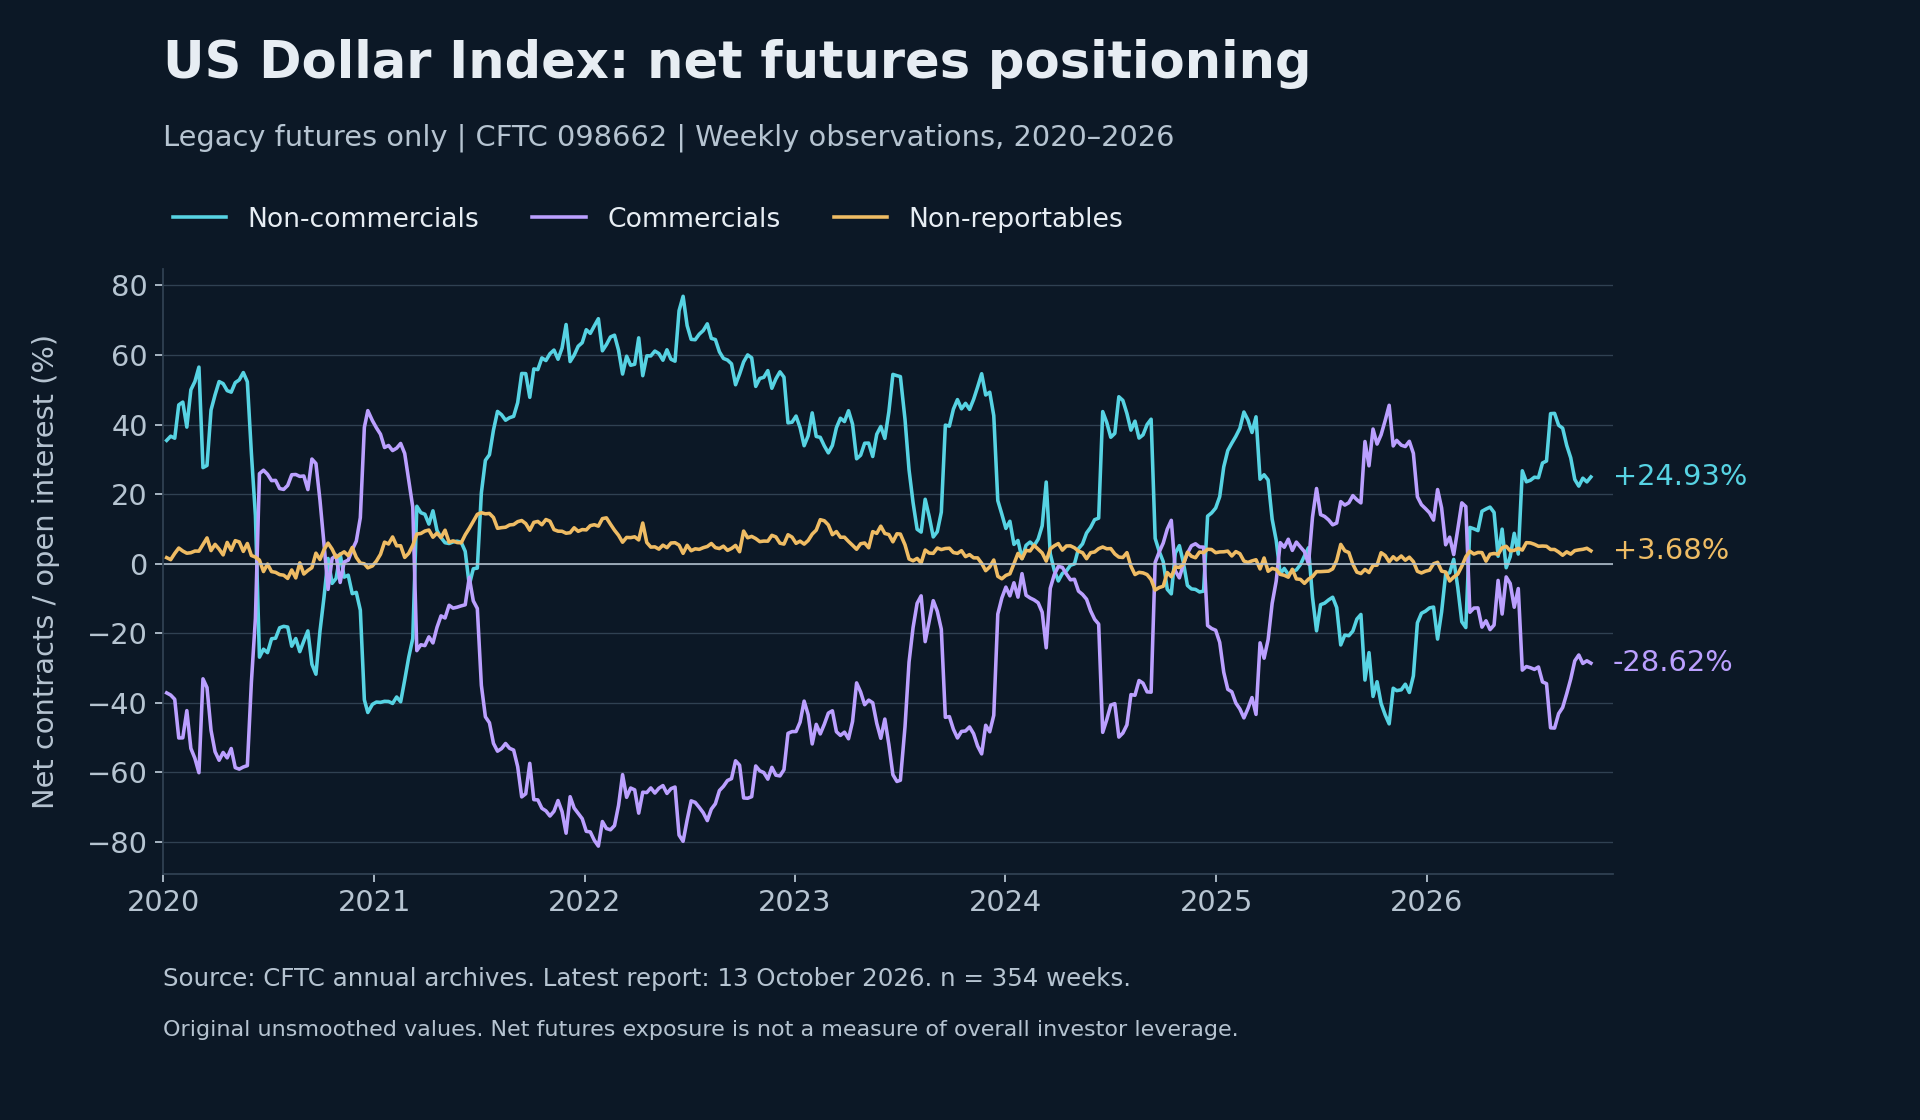
The chart highlights earlier dollar reversals around similar positioning patterns. I would watch for price weakness and long liquidation to confirm the next move.
A euro recovery would have a particularly strong effect on the dollar index because EUR is its largest component. An AUD rebound could also come from stronger Chinese data and changed positioning, alongside any dollar weakness. ICE USDX composition.
The potential later transition is different. If falling asset prices create a broad need for dollar funding or prompt defensive flows, the dollar could strengthen again. I would not assume that an early dollar decline continues throughout a prolonged equity bear market. The sequence I am considering is a relative FX recovery first, followed by a possible change in the dominant driver as global stress intensifies.
8. Euro: a relative recovery can precede renewed weakness
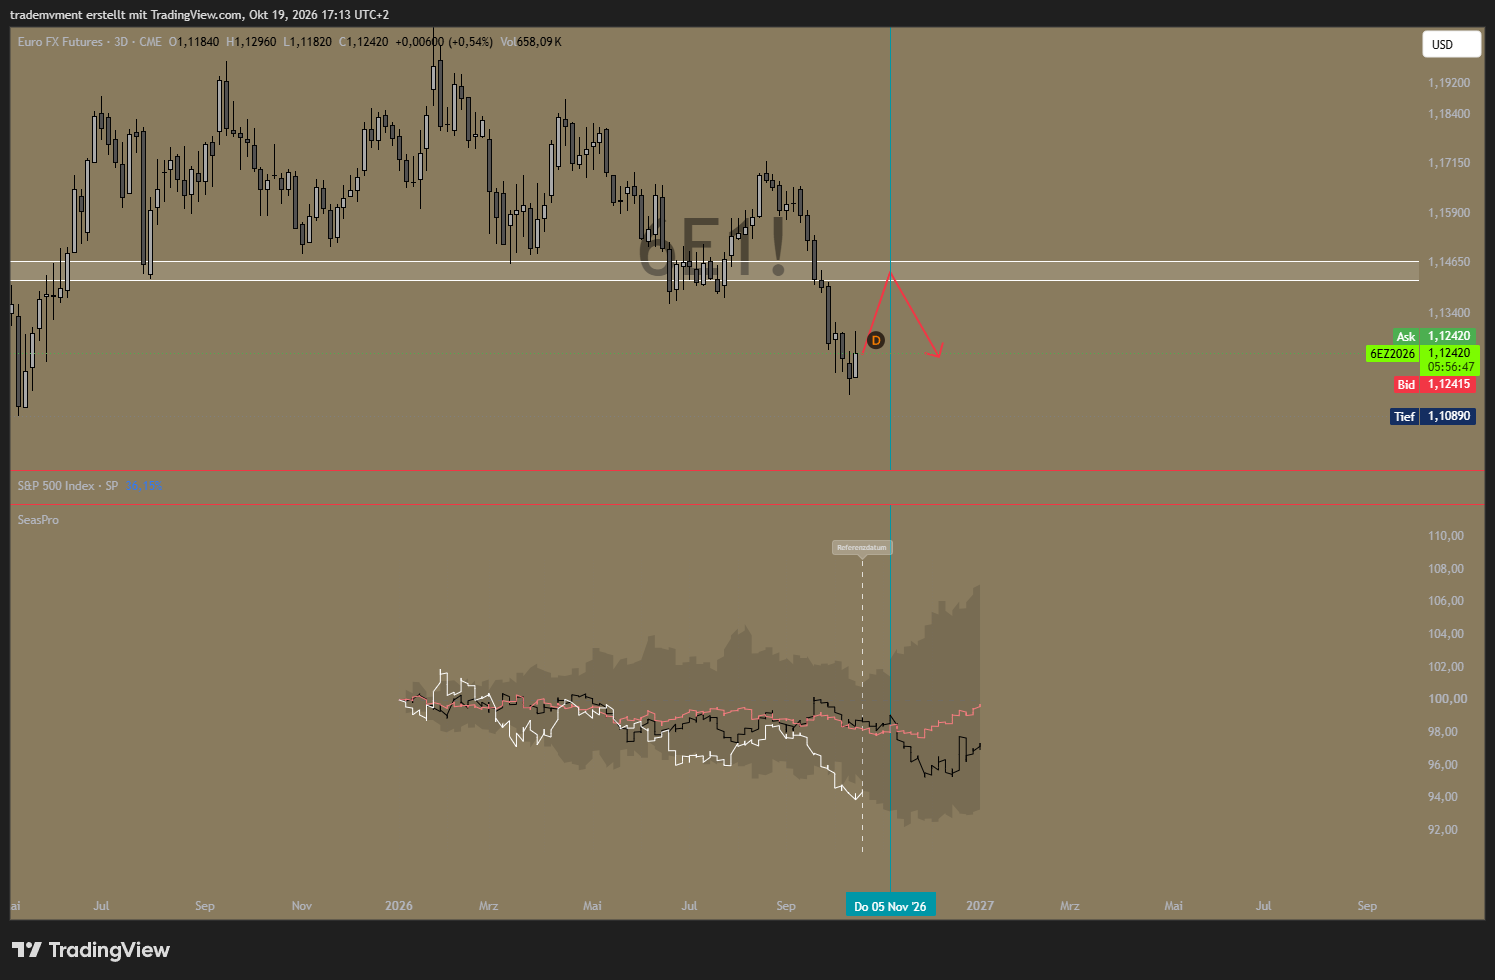
Original: Euro seasonality relative to the dollar.
The euro chart shows a rebound towards resistance, with a possible rejection later. The seasonal comparison supports room for a late-year recovery.
A temporary EUR recovery against USD could reflect reduced dollar demand, an unwinding of euro shorts, or a relative reassessment of policy. The ECB has already raised rates. If the market prices more persistence in euro-area rates than it previously assumed, the euro could recover despite a difficult domestic growth outlook.
This would be a relative trade, not evidence that Europe is insulated from demand destruction. A later deterioration in energy-sensitive activity, credit or consumption could weaken the euro again. The chart's return towards an overhead zone would then represent a recovery within a vulnerable structure rather than a durable change of economic regime.
For the S&P, this early euro strength could offer some relief through dollar translation and broader risk sentiment. That is one plausible support for an interim equity recovery. It would not resolve an underlying deterioration in sales volumes or margins if that deterioration subsequently materialises.
9. CHF: the unusual seasonal divergence and a possible carry unwind
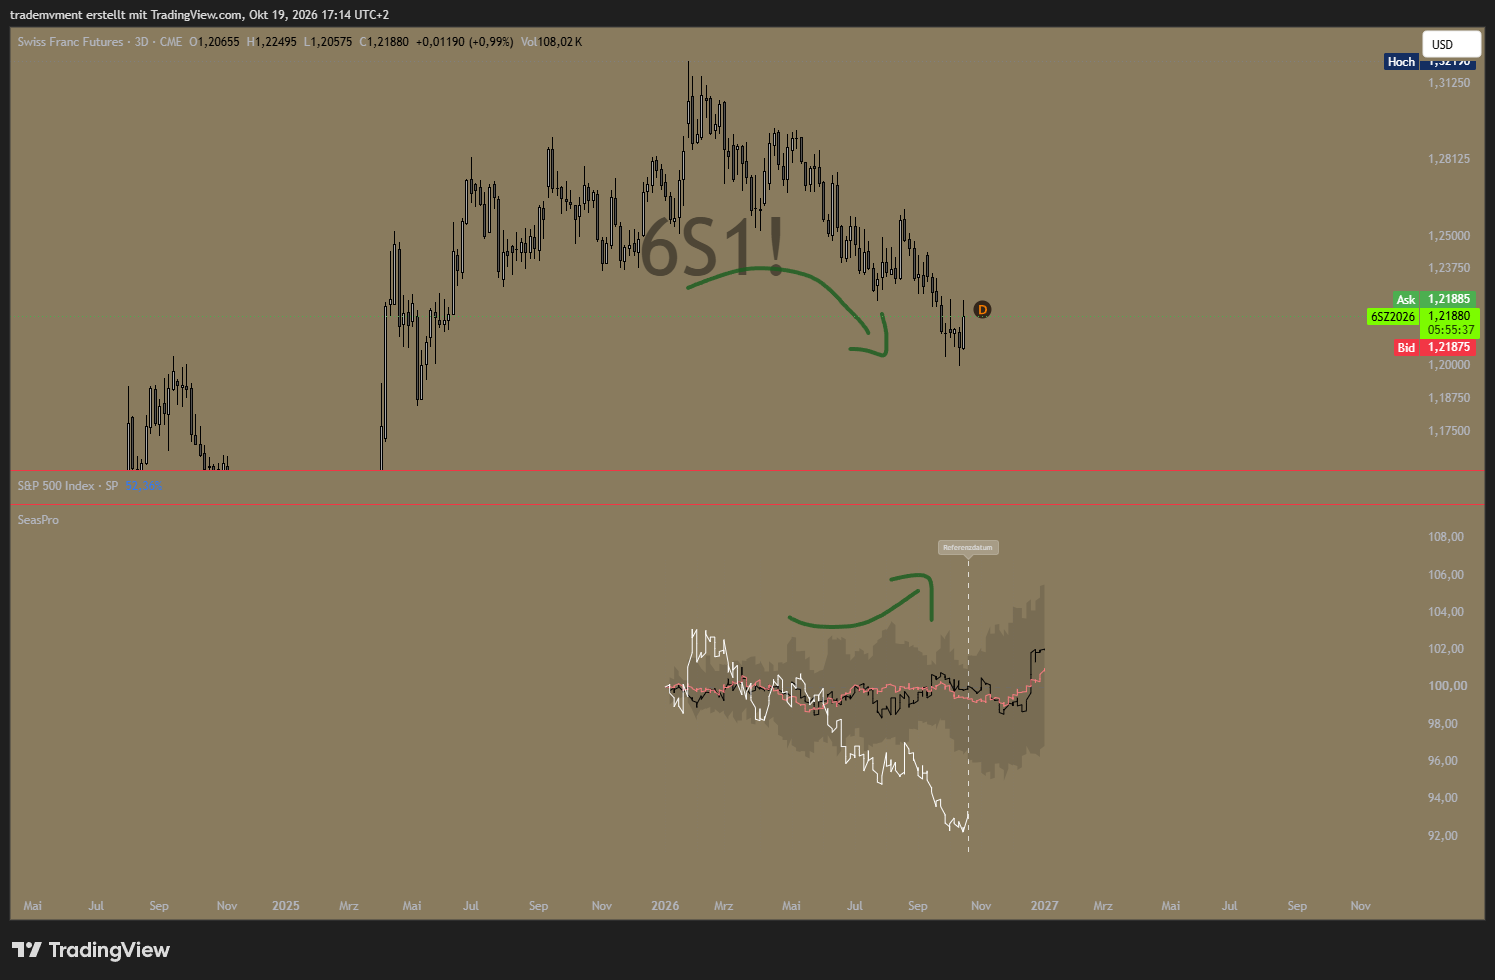
Original: CHF seasonal divergence.
CHF futures have weakened while the seasonal comparison turns higher later in the year. I am watching for a recovery that closes part of that divergence.
My existing EUR/CHF carry-unwind analysis considers whether the franc's relatively low funding cost could be important in a subsequent reversal. The SNB held its policy rate at 0% in September and retained the option of foreign-exchange intervention. SNB September assessment.
Investors who borrow francs to buy higher-yielding assets may need to buy francs back when they reduce those positions. A fall in leveraged assets can accelerate that demand and strengthen CHF.
A carry unwind can amplify a funding currency’s appreciation. This is the mechanism I am watching in CHF as leveraged positions become more vulnerable. BIS Bulletin 124, May 2026.
A broader carry unwind would connect CHF strength with falling leveraged assets. Swiss policy developments can also move the franc independently.
EUR/USD can rise while EUR/CHF falls if the franc strengthens more than the euro against the dollar.
In the chart, rising CHF futures mean a stronger franc.
10. NZD: a possible recovery, with two opposing food-price channels
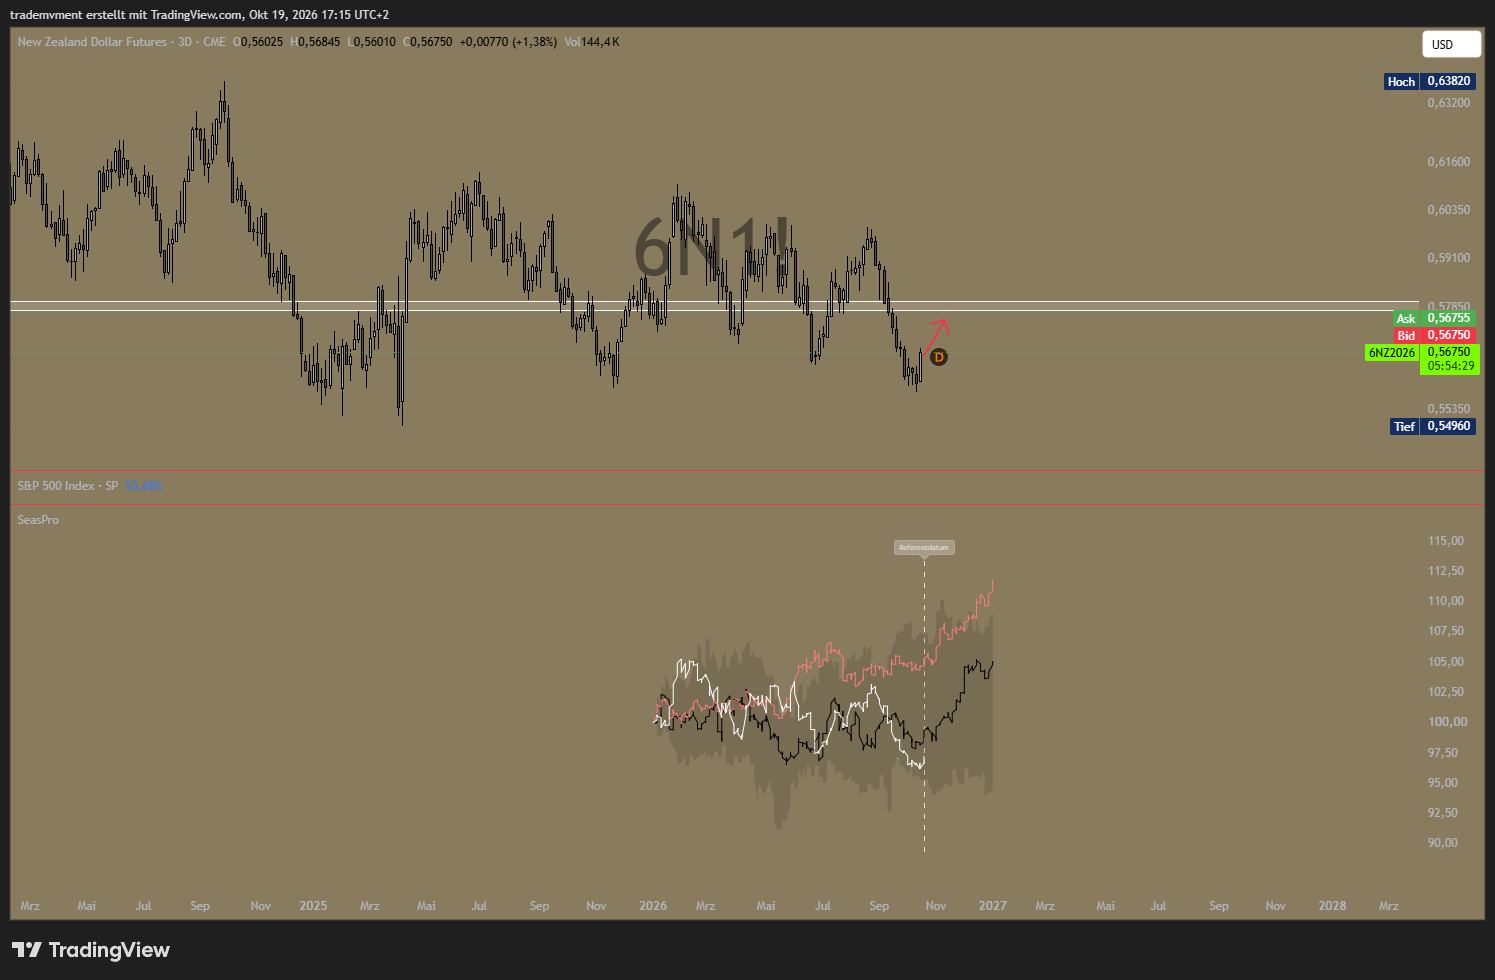
Original: NZD recovery scenario.
The NZD chart shows a possible rebound from recent lows towards resistance. A weaker dollar and improving risk sentiment could support it.
Cheaper agricultural products and food could help through household purchasing power or lower business input costs. Lower imported fuel, fertiliser or feed costs can also improve particular producers' economics. If those effects support real activity while export revenues hold up, they could contribute to a temporary NZD recovery.
However, New Zealand is also an agricultural exporter. A broad decline in dairy, meat or other export prices can reduce export income and weaken its terms of trade. Faster domestic disinflation could also bring forward easing expectations and reduce interest-rate support for NZD. Cheaper food is therefore not automatically bullish for the currency.
The RBNZ has also raised rates, while strong agricultural export prices have supported New Zealand’s external income. For NZD to benefit from cheaper inputs, that export support needs to hold up. RBNZ September decision and assessment.
For my recovery scenario, the favourable mix would be relief in imported costs, resilient export receipts and weaker USD demand. Falling export prices caused by a worsening global economy would be a different mix, more consistent with renewed NZD pressure later in the cycle.
11. CAD: why an oil-sensitive currency could still recover first
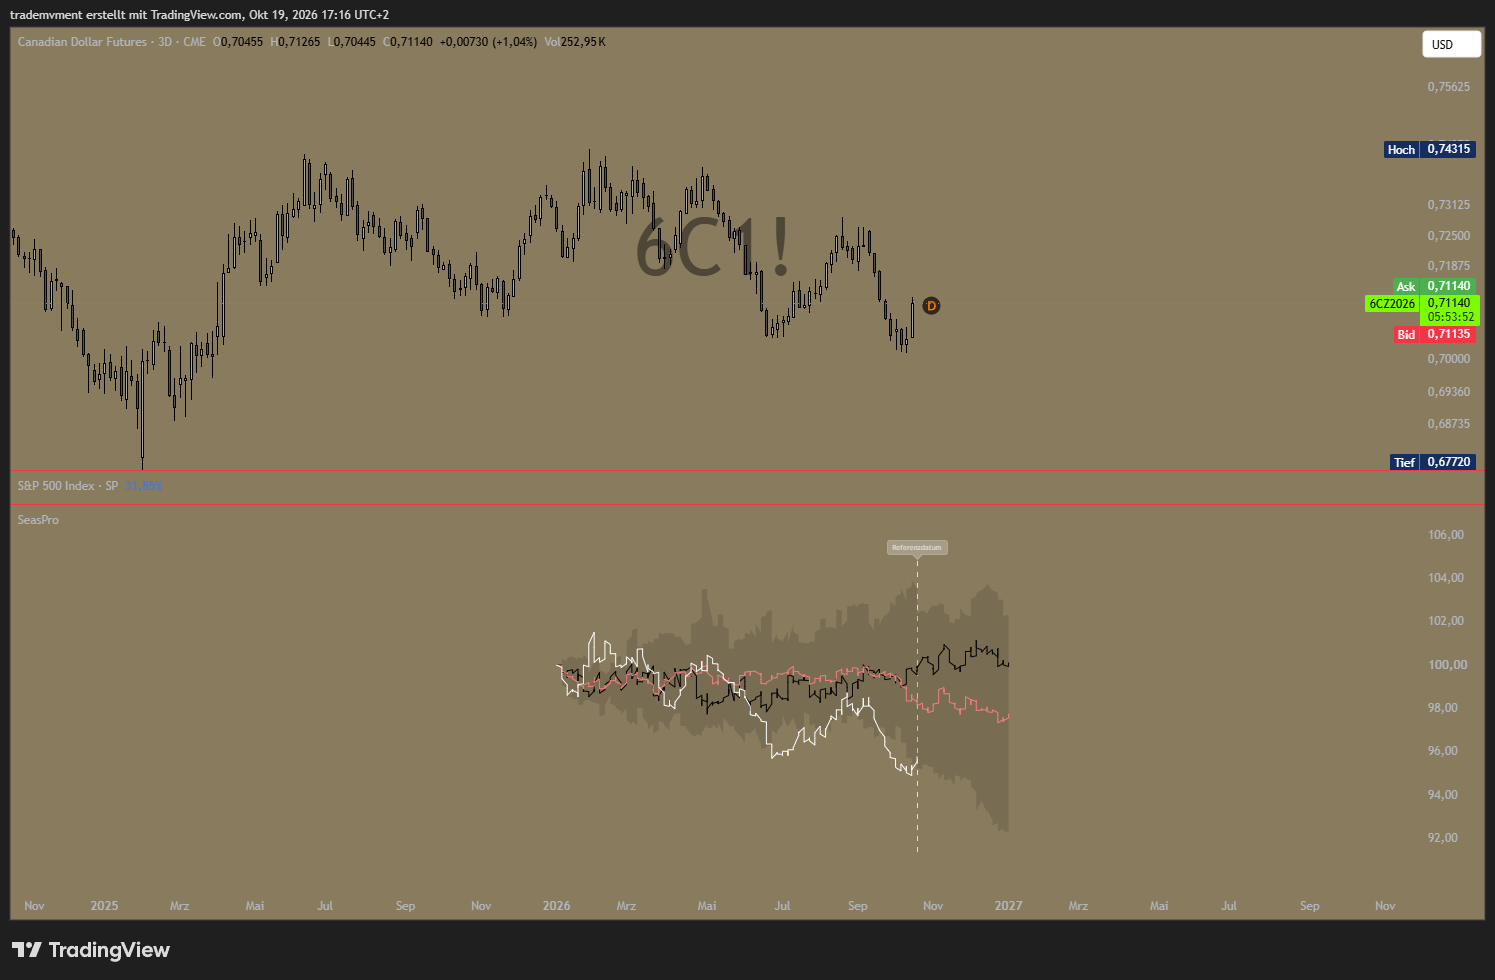
Original: CAD recovery.
CAD has rebounded from its recent low. The seasonal comparison is mixed, so I would look to weaker USD demand and improving risk sentiment to sustain the recovery.
The Bank of Canada has held rates steady. A CAD recovery could still come from weaker dollar demand and a reassessment of the relative US policy outlook. Bank of Canada September decision.
The oil connection creates a real tension with my broader demand-destruction view. Lower energy costs can help households and non-energy businesses, but weaker oil export prices can reduce Canadian income. If the global economy weakens materially, the adverse export and risk-sentiment effects could outweigh consumer relief.
I place the CAD recovery in the earlier part of the sequence. A later combination of weaker oil demand and renewed dollar strength would make it harder to sustain.
12. AUD: changed positioning gives the recovery more room
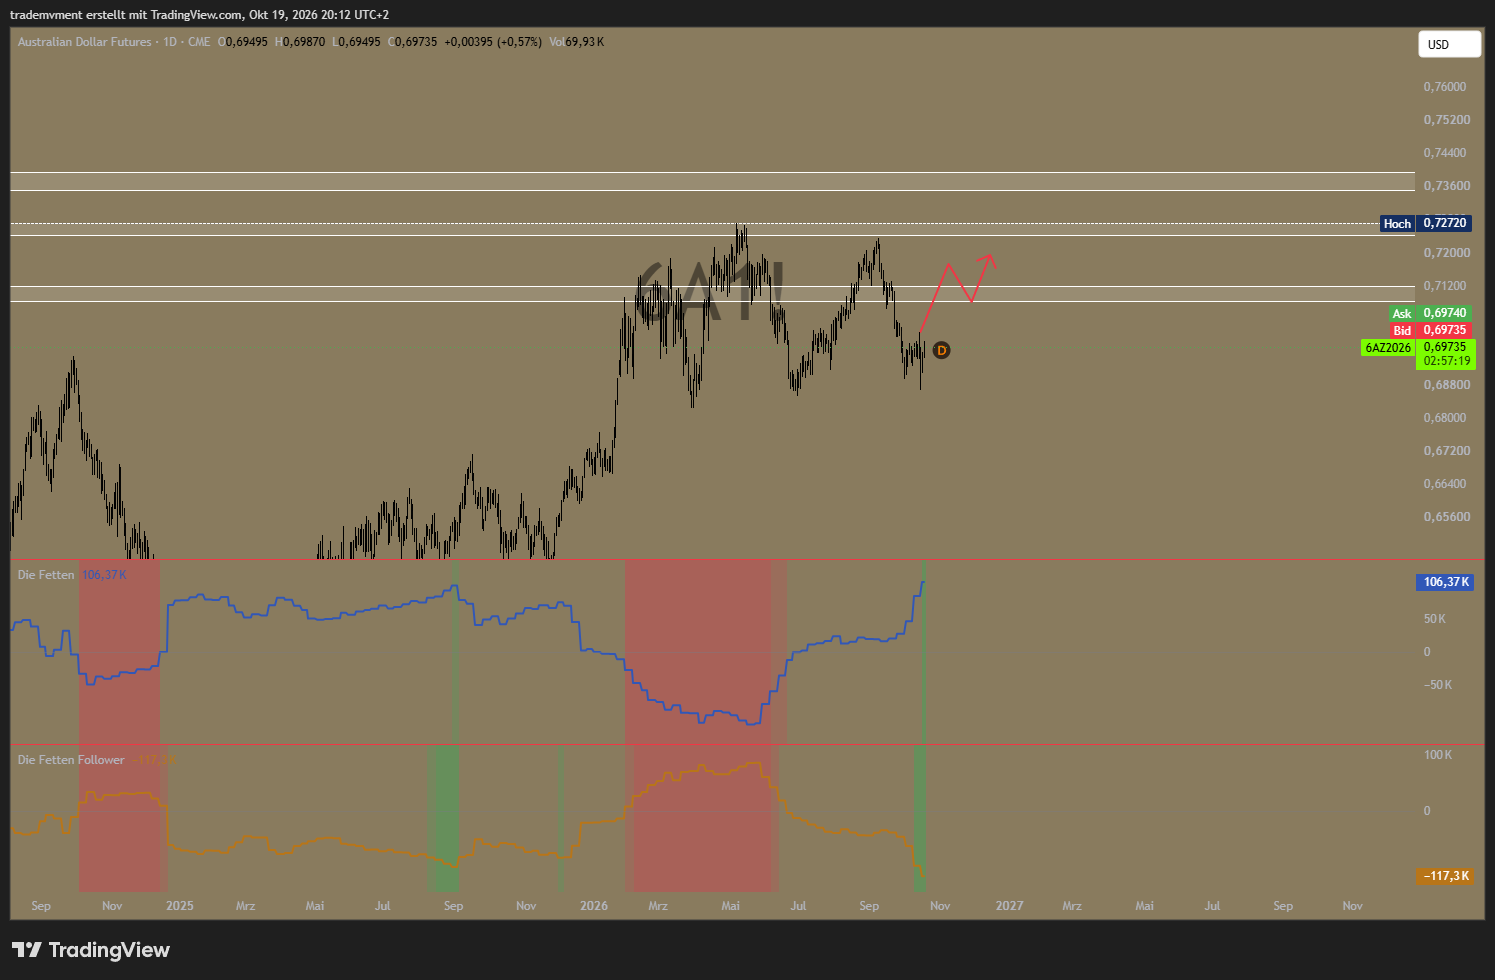
Updated chart, 19 October: AUD price and COT positioning.
My earlier AUD/USD trade was based on a different picture. Positioning and the data from China have changed since then. I no longer assume that an AUD rebound must be followed by another drop. Earlier AUD/USD analysis.
The updated chart shows the Commercials building a strong net long position, while the large speculators are heavily net short. If some of those shorts are closed, that could add buying pressure. The red path shows a possible recovery with pullbacks along the way. CFTC AUD positioning, 13 October.
Stronger recent Chinese data give AUD more support, alongside a possible weaker US dollar. The RBA has also raised rates, which can support the currency. I am no longer using future rate cuts as the main reason to expect another AUD decline. RBA September decision.
For now, I see room for a more sustained AUD recovery. A later decline remains possible if conditions weaken again, but the old trade is no longer my guide for that move.
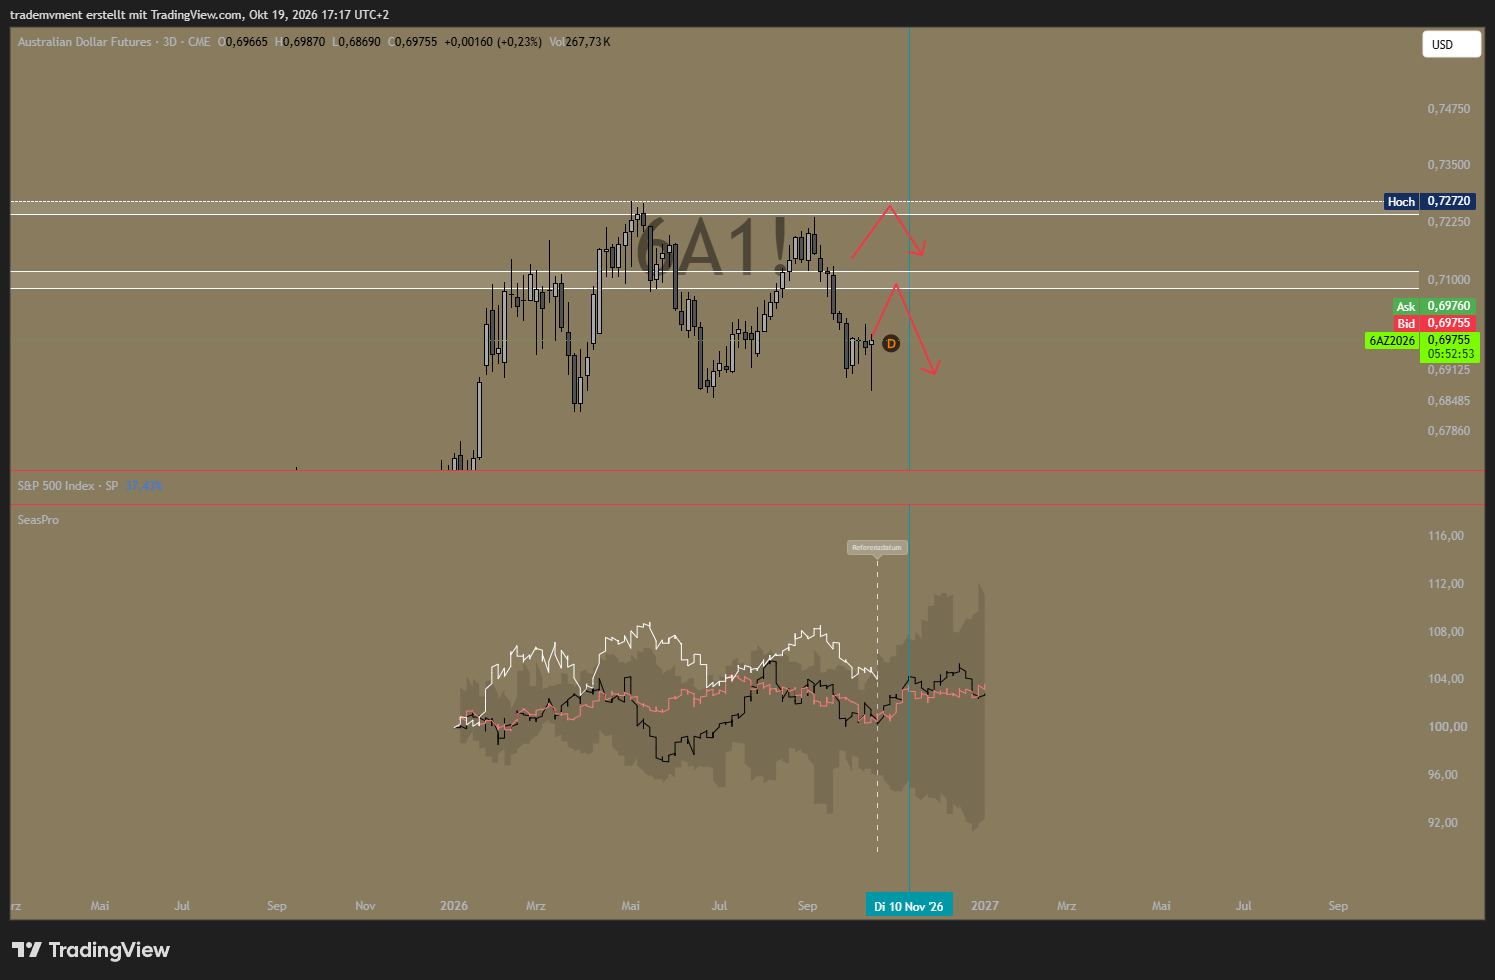
Earlier view for comparison: the previous rebound-and-drop scenario. This is no longer the AUD outlook used here.
13. China: stronger recent data change the picture
The latest Chinese releases were more positive than the picture behind my earlier AUD view. Third-quarter growth and September retail sales beat expectations, while industrial production also picked up. This weakens the argument for an immediate, broad fall in demand. NBS growth and activity release, 19 October, Reuters results and forecasts.
Firmer Chinese activity can improve the outlook for Australian exports and support AUD. It can also help the outlook for global company earnings. That gives a recovery more room than my earlier view allowed.
The recovery is still uneven, with property and investment remaining weak. Aggregate producer prices have risen, although food and consumer-goods prices remain below a year earlier. Manufacturing activity is only just above the expansion threshold. These are risks, but they do not cancel out the improvement in the latest releases. NBS September industrial producer prices, NBS September PMI release.
I therefore see a sharper fall in Chinese demand as a possible later risk. The latest data weaken this part of my bearish S&P case. Inflation and expensive borrowing remain concerns, but I should not use China as if its economy were already weakening across the board.
14. How the sequence could develop through 2027
The combined picture suggests a path with several transitions rather than one uninterrupted crash:
| Stage | Possible market behaviour | What would have to drive it |
|---|---|---|
| Near-term positioning adjustment | USD weakens; several other currencies recover; S&P can retest resistance | Relative rate repricing, position reduction, seasonal support and stabilising risk appetite |
| Initial equity decline | Support fails and selling becomes faster | A disappointment in earnings, inflation or financing conditions, amplified by exposed positions |
| Interim recovery, potentially Q1–Q2 2027 | Equities rebound despite a vulnerable medium-term backdrop | Short covering, lower input prices, expectations of policy relief or stabilising data |
| Longer-recovery alternative | Recovery extends towards Q3 2027 | Earnings and liquidity remain resilient longer than the bearish case assumes |
| Later deterioration | A deeper adjustment develops, potentially more slowly through later 2027 | Weaker sales and margins, refinancing pressure and employment effects become harder to offset |
These are timing scenarios. The longer-recovery alternative refers to Q3 2027, and resilient earnings could extend or overturn the expected sequence.
The distinction between a sharp first decline and a slower later decline has an economic basis. Liquidation can compress a large price move into a short period because many participants react to the same loss of support or increase in volatility. Earnings deterioration is often revealed through successive company reports, guidance changes and refinancing events. It can therefore produce a more drawn-out reassessment.
The recovery between those phases could be substantial. Investors may respond quickly to falling inflation or lower bond yields even while earlier tightening is still affecting borrowers. Whether that recovery becomes durable depends on the reason yields and commodity prices are falling and on what happens to earnings.
My bearish scenario would become more convincing if the recovery failed to broaden, credit conditions tightened and earnings guidance weakened together. A rising index with improving breadth, resilient profits and durable disinflation would instead argue for revising the outlook rather than extending the deadline of an unchanged forecast.
15. Earnings and valuation: how a modest economic change can become a larger market move
The S&P reflects both earnings and the multiple investors pay for them. Falling profits and a lower multiple can reinforce each other, producing a large decline without a collapse in the wider economy.
The following is a hypothetical sensitivity exercise, not current S&P valuation data or a price forecast. Starting from an index value of 100:
| Change in earnings | Unchanged earnings multiple | Multiple −10% | Multiple −20% |
|---|---|---|---|
| 0% | 100 | 90 | 80 |
| −10% | 90 | 81 | 72 |
| −20% | 80 | 72 | 64 |
A simultaneous 10% fall in earnings and the earnings multiple would take 19% off the index. The table illustrates how the two effects can reinforce each other.
Lower yields and resilient profits could cushion the adjustment. That is one reason I allow for a substantial recovery between the two bearish phases.
16. The supplied potential S&P positions
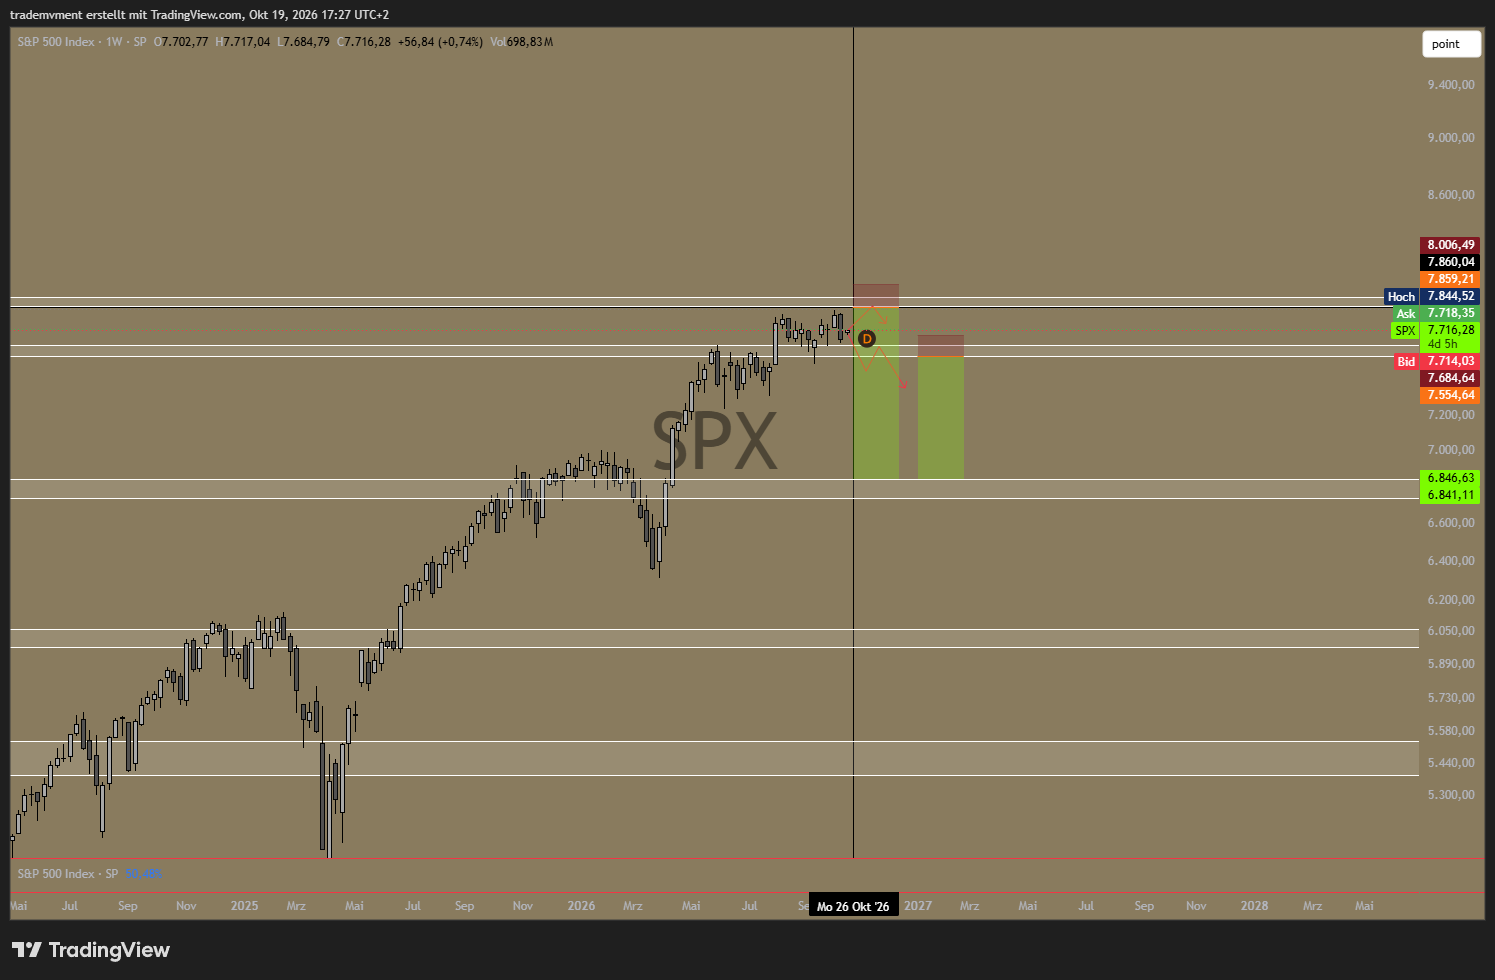
Original: Potential positions. These are potential setups.
The chart contains two possible short setups:
| Proposed scenario | Entry reference | Stop reference | Target reference | Price risk | Price reward | Gross reward / risk |
|---|---|---|---|---|---|---|
| Recovery into the upper area | 7,859.21 | 8,006.49 | 6,846.63 | 147.28 | 1,012.58 | 6.88 R |
| Breakdown and lower retest | 7,554.64 | 7,684.64 | 6,841.11 | 130.00 | 713.53 | 5.49 R |
The first setup follows a recovery into resistance. The second follows a breakdown and a lower retest. I would assess each when its price structure develops.
Risk and reward are measured in index points before trading costs, financing, slippage and gaps. Position size and account risk need to be assessed separately.
The marked targets describe an initial correction of roughly 13% from the charted high. A deeper bear-market phase would be a later development.
I would reassess the later phase using the price structure, earnings and financing conditions at that time.
18. The Benner cycle: a historical reference with limited evidential weight
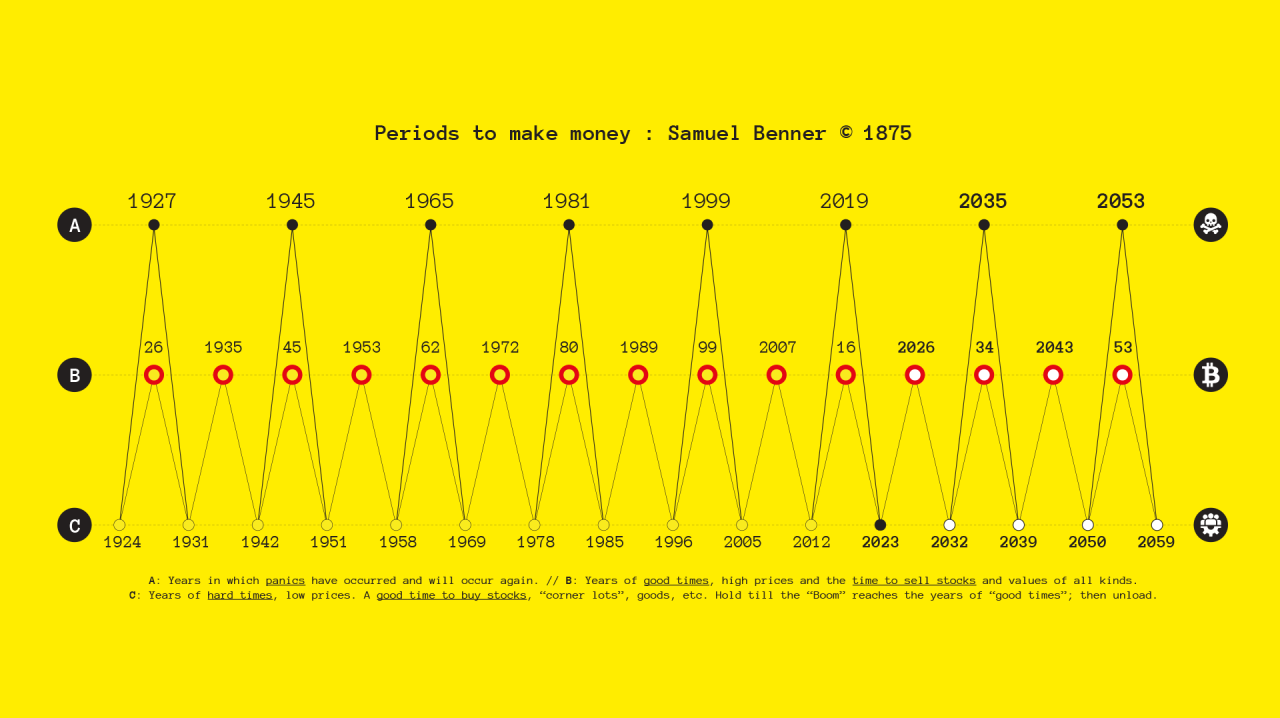
The diagram places 2026 in the high-price phase, followed by a low around 2032 and a panic year in 2035. This modern Benner adaptation provides historical context rather than a specific 2027 S&P forecast.
Benner’s historical work examined recurring commodity-price patterns. I use the modern diagram as background to the cycle discussion. Library of Congress.
I give the cycle limited weight. The outlook depends on price, earnings and financing conditions.
My working conclusion
I expect a difficult adjustment in the S&P 500, potentially lasting through 2027, with more than one distinct market phase. The first selloff could be sharp. A recovery into Q1–Q2 2027, or a longer recovery towards Q3, could then make the outlook appear more comfortable before a later deterioration in earnings and financing conditions produces another, potentially deeper decline.
An initial dollar decline and recoveries in other currencies fit inside that sequence. The euro could benefit from relative policy repricing. CHF could benefit from a funding-position reversal. NZD and CAD could recover with reduced dollar demand, provided their export-income risks do not dominate. AUD has additional support from changed positioning and stronger recent Chinese data, so I no longer assume its recovery must be brief. These are different mechanisms operating over overlapping periods.
Stronger Chinese data also weaken the immediate demand-destruction argument. They do not remove the risks from inflation and expensive borrowing, but they give a recovery more room.
The possible seasonal dip around 26 October, persistent smaller-participant longs and the commercial positioning shift are the chart signals I am watching. Inflation, tighter financing and weaker demand provide the broader bearish framework.
I will judge this scenario by the market's response at resistance and by the direction of earnings, credit and real activity. Sustained improvement across those measures would change my outlook.
Disclosure: This research documents my personal market interpretation and potential position scenarios. The S&P positions shown are plans, not confirmation of execution. Historical comparisons, seasonality and hypothetical calculations do not establish future results. This publication is general research, not individual investment advice.
Additional COT sources
Positioning sources: S&P futures and CFTC historical data.
Loading comments…