WTI Crude Oil Short — Macro Swing Setup
Original analysis
English edition of the original analysis by trademvment. Original TradingView publication ↗
1. Economic thesis
The initial rise in oil prices was driven mainly by a geopolitical supply shock.
My bearish thesis, however, focuses on the economic consequences of that shock.
Higher oil prices increase transport, production and consumer costs. This keeps inflation elevated while also putting pressure on businesses, households and overall economic activity.
My base case includes:
- declining global economic activity
- weaker industrial production
- falling transport and consumer demand
- increasing cost pressure on businesses
- financing conditions that remain restrictive
- increasing demand destruction
- weaker global oil consumption over the coming quarters
The World Bank currently expects a significant slowdown in global growth in 2026. The energy price shock and its economic consequences play a central role.
This creates a paradoxical environment for oil:
The supply shock initially pushes oil prices and inflation higher. The resulting economic damage, however, subsequently reduces the very demand needed to sustain those prices.
2. Central bank thesis
Several major central banks are facing an increasingly difficult monetary policy trade-off.
The energy price shock keeps inflation above target in many economies, limiting the scope for aggressive monetary easing.
At the same time, some labour markets, businesses and components of domestic demand are already showing signs of weakening.
The starting point is not identical in every country. While the US economy and the euro area have so far remained relatively resilient, the economic strain is already more visible in the United Kingdom and Australia.
Bank of England
UK inflation stands at 3.1% and could rise further as higher energy prices increasingly spread through the economy.
At the same time, the labour market remains weak, while elevated financing costs weigh on households and businesses.
The Bank of England held its policy rate at 3.75%. Three members, however, already voted for a further increase to 4%.
https://www.bankofengland.co.uk/monetary-policy-summary-and-minutes/2026/september-2026
Reserve Bank of Australia
The RBA notes that inflation remains too high, while consumption growth is slowing and labour market conditions have weakened.
After three rate increases in 2026, Australian monetary policy is already restrictive. Further increases have nevertheless not been ruled out if inflation risks rise again.
https://www.rba.gov.au/media-releases/2026/mr-26-19.html
European Central Bank
The ECB raised its three key interest rates by 25 basis points each.
Inflation stands at 3.3% and is heavily influenced by the energy price shock. At the same time, the ECB warns of downside risks to consumption, investment and economic growth.
The euro area economy and labour market have so far remained relatively resilient. Higher financing costs, however, increase the pressure on future economic activity.
Bank of Canada
Canadian inflation stands at around 3%, mainly because of higher gasoline prices.
Demand for labour remains subdued, excess capacity persists in the economy, and uncertainty about future growth has increased.
The Bank of Canada held its policy rate at 2.25%, while continuing to monitor the risk that higher energy costs spread to other areas of inflation.
https://www.bankofcanada.ca/2026/09/fad-press-release-2026-09-02/
Federal Reserve
The Federal Reserve raised its target range by 25 basis points to 3.75–4.00% because inflation remains elevated.
Unlike some other economies, the Fed still describes the US economy and labour market as relatively solid.
The additional rate increase nevertheless tightens global financing conditions. A stronger dollar, higher capital costs and reduced international liquidity can put additional pressure on other economies.
https://www.federalreserve.gov/newsevents/pressreleases/monetary20260916a.htm
The broader policy conflict
Central banks increasingly have to weigh two risks:
- tolerating energy-driven inflation that remains elevated for longer
- keeping monetary policy restrictive or raising rates further, risking a sharper slowdown in economic activity
If rates remain elevated for longer or rise further to prevent indirect and second-round inflation effects from the oil price shock, financing costs will put additional pressure on households and businesses.
Higher interest rates weigh on:
- business investment
- consumer demand
- lending
- industrial production
- transport activity
- international trade
This creates the following macroeconomic chain:
Oil price shock → rising inflation → restrictive monetary policy → higher financing costs → declining economic activity → falling oil demand
The first phase of an oil price shock is bullish because the market focuses mainly on constrained supply.
The later phase can become distinctly bearish once the economic damage and resulting demand destruction become the dominant factors.
The initial oil price shock creates inflation.
The monetary policy response reduces demand.
Once global economic activity weakens significantly, the same process that initially pushed oil prices higher can ultimately cause a sharp decline in oil demand and prices.
3. Historical comparisons
The period after the oil crises
A comparable mechanism developed after the oil crises of the late 1970s and early 1980s.
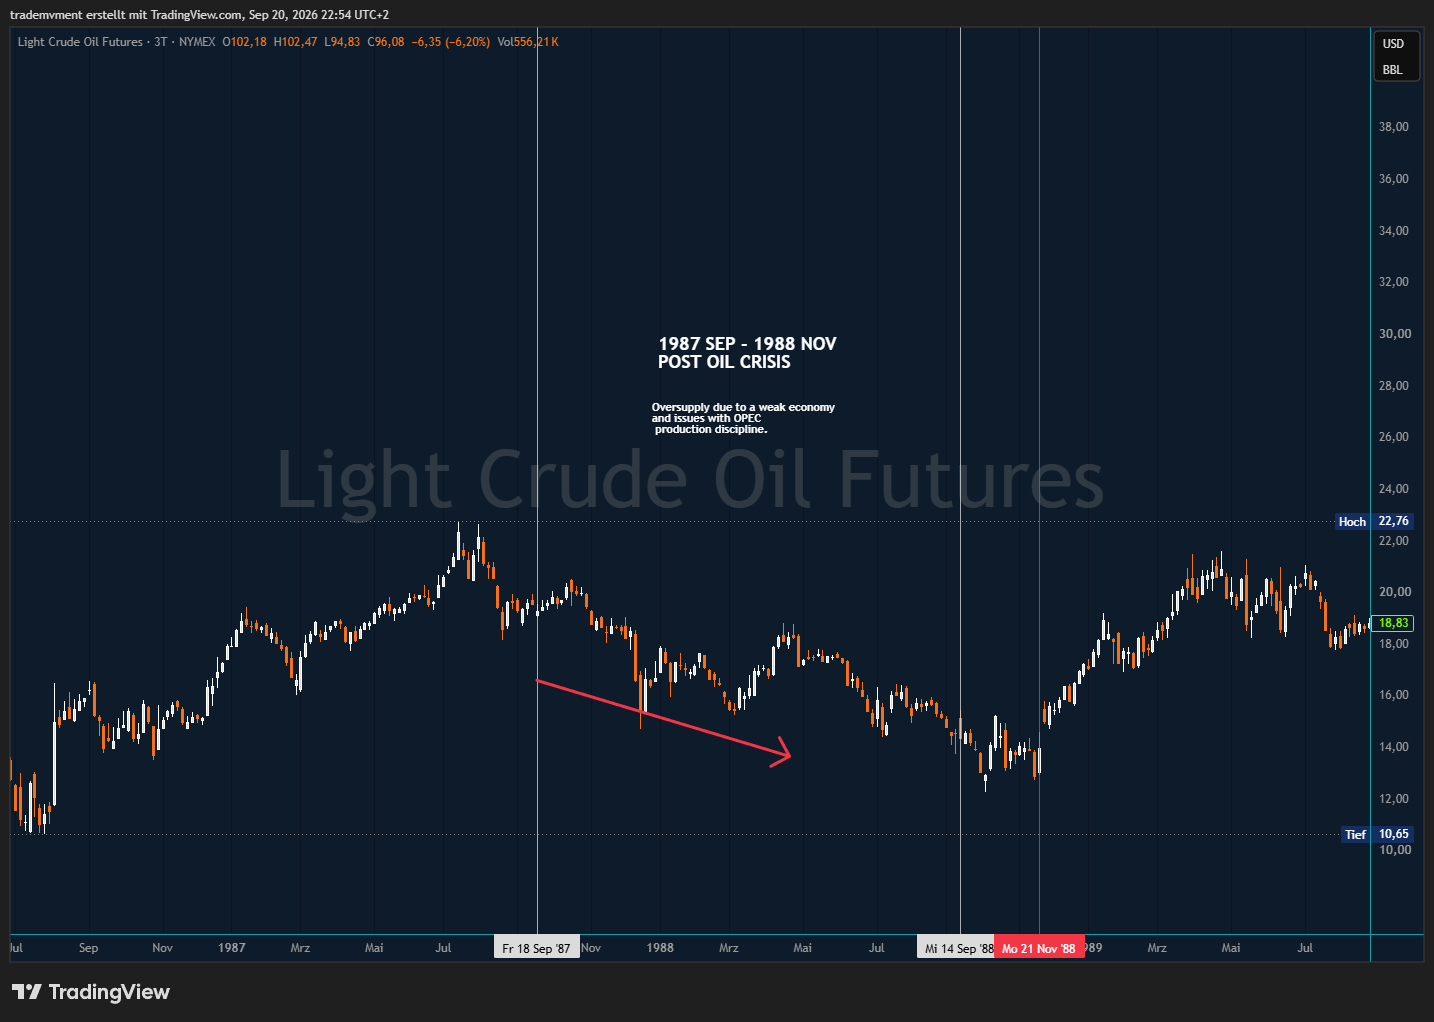
Oil prices initially rose because of supply disruptions and geopolitical uncertainty. Inflation accelerated, and the Federal Reserve responded with extremely restrictive monetary policy.
The recessions that followed weakened global oil consumption. At the same time, high prices encouraged greater energy efficiency and additional production outside OPEC.
By the mid-1980s, the market had shifted from supply scarcity towards excess supply and insufficient demand.
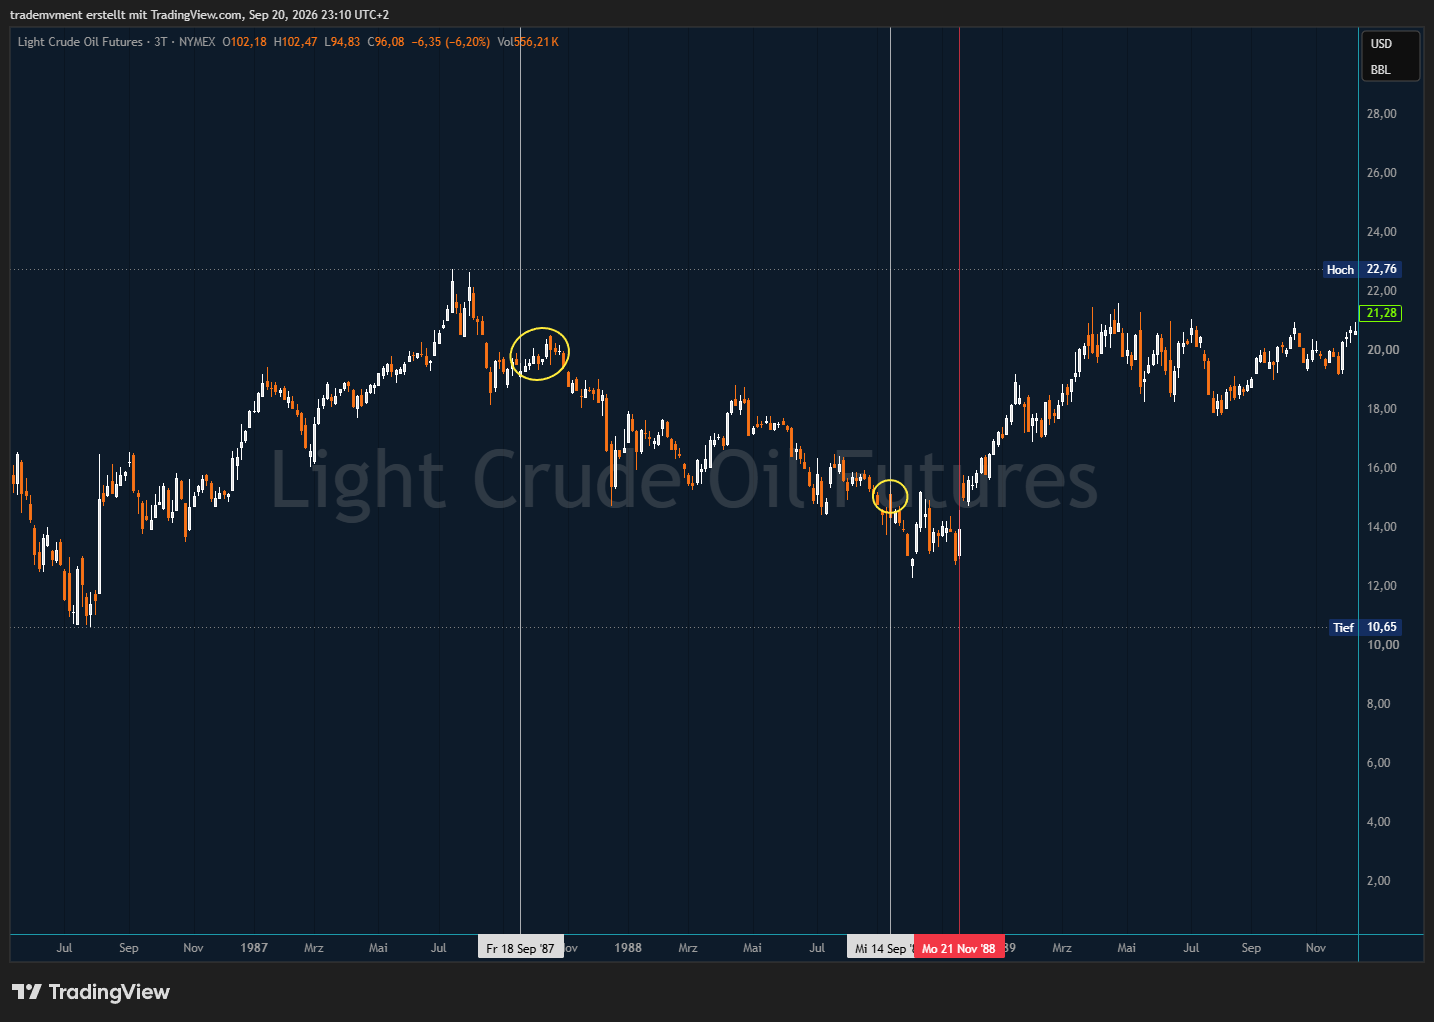
Between September 1987 and November 1988, oil prices experienced another significant decline. Weak economic activity and problems with production discipline within OPEC added further pressure.
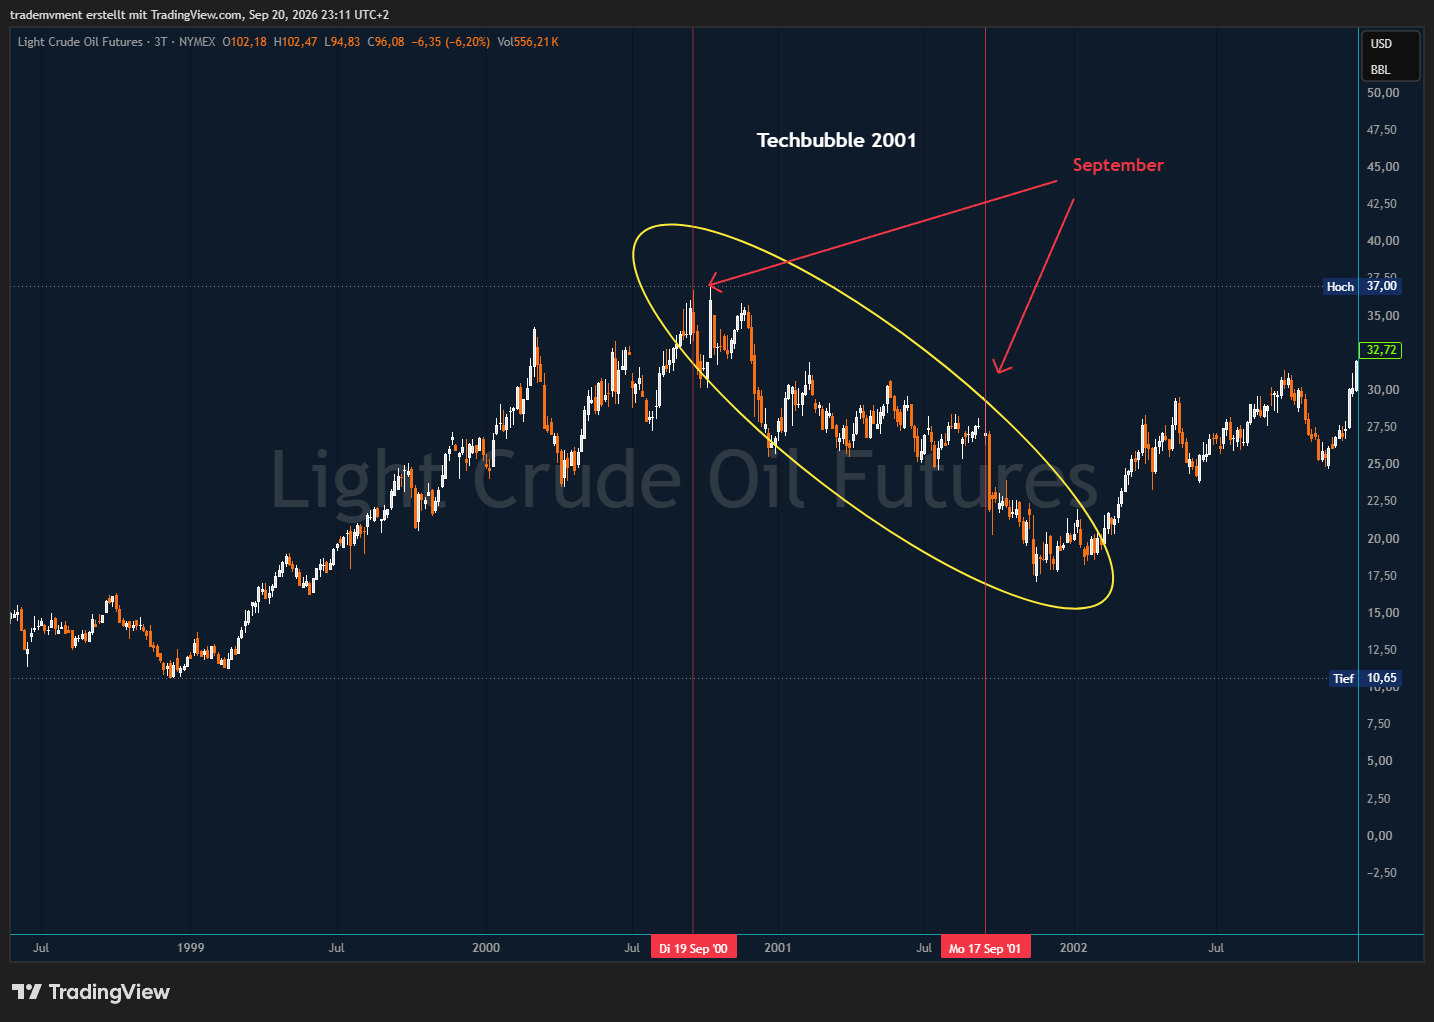
The economic slowdown of 2000–2001
A similar underlying principle was visible during the economic slowdown of 2000–2001.
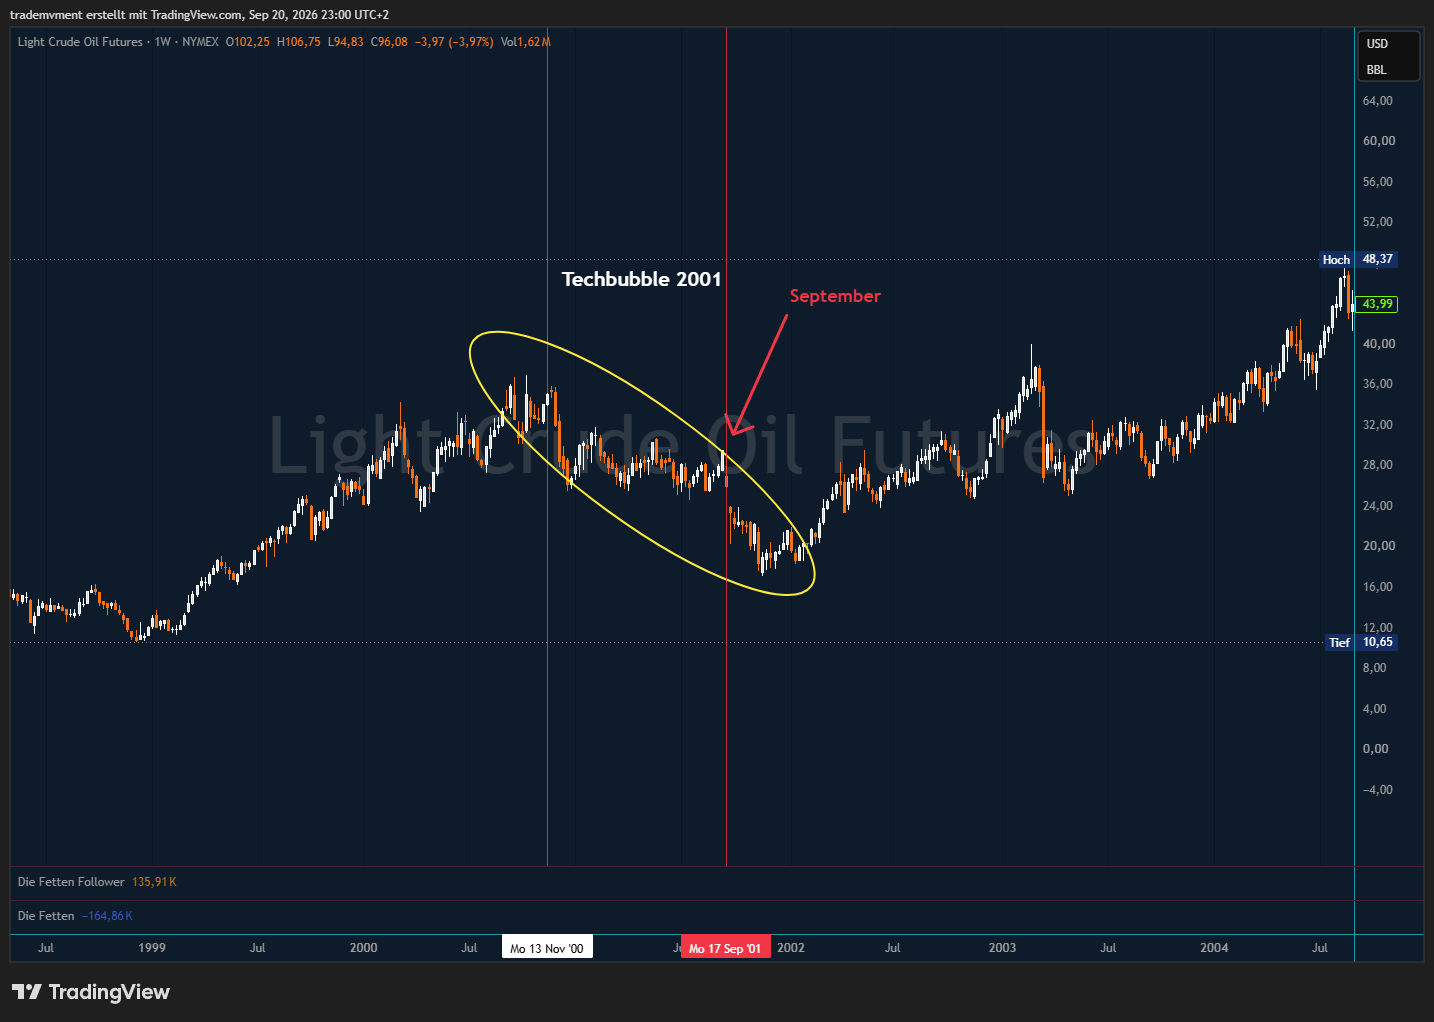
Oil prices had already started falling before September 2001 as economic activity and demand weakened.
The events in September accelerated a development that had already begun.
The global financial crisis of 2008
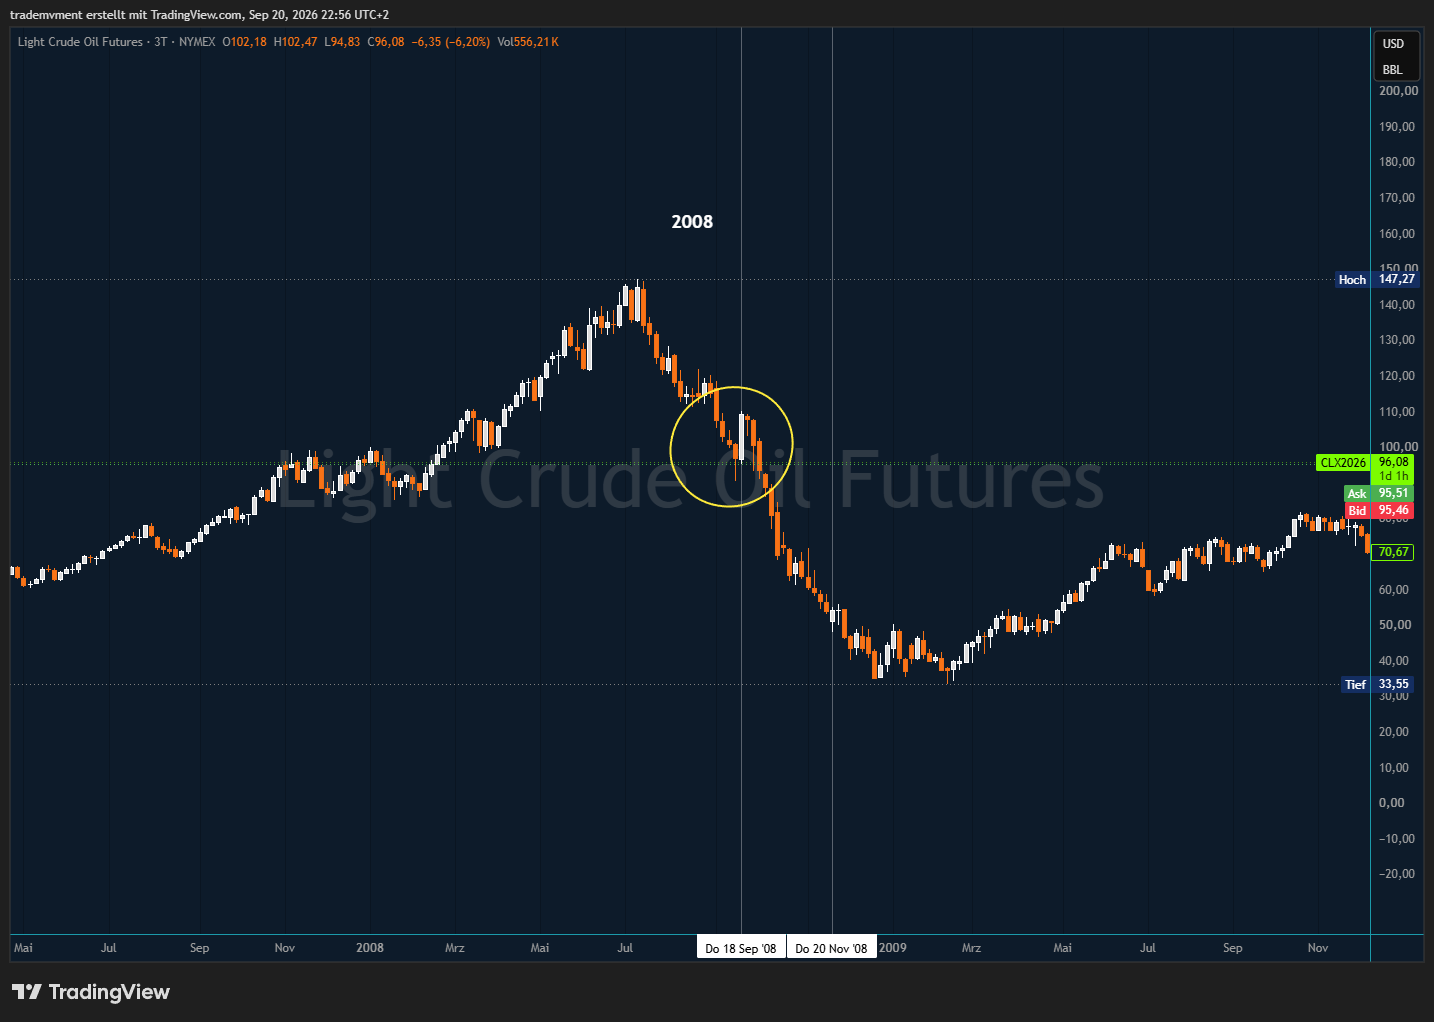
The most aggressive example was the global financial crisis of 2008.
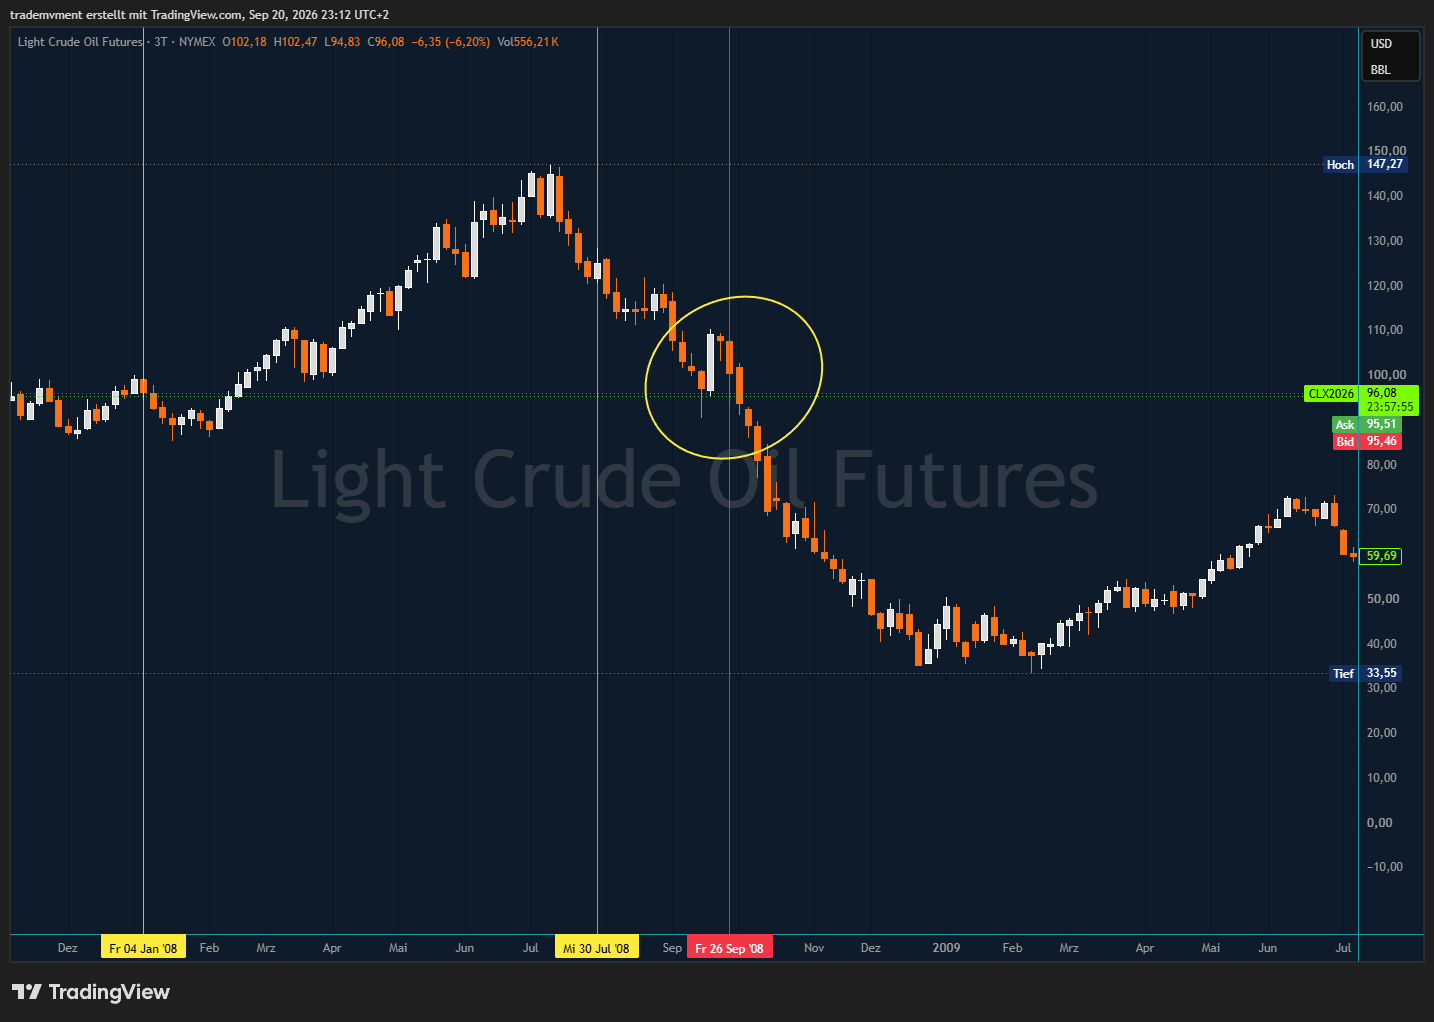
Oil initially traded above $140 while the financial system and the global economy were already deteriorating significantly.
Once the market's focus shifted from inflation and scarcity towards recession and collapsing demand, a dramatic repricing followed.
COVID
COVID represented an even more aggressive form of demand destruction.
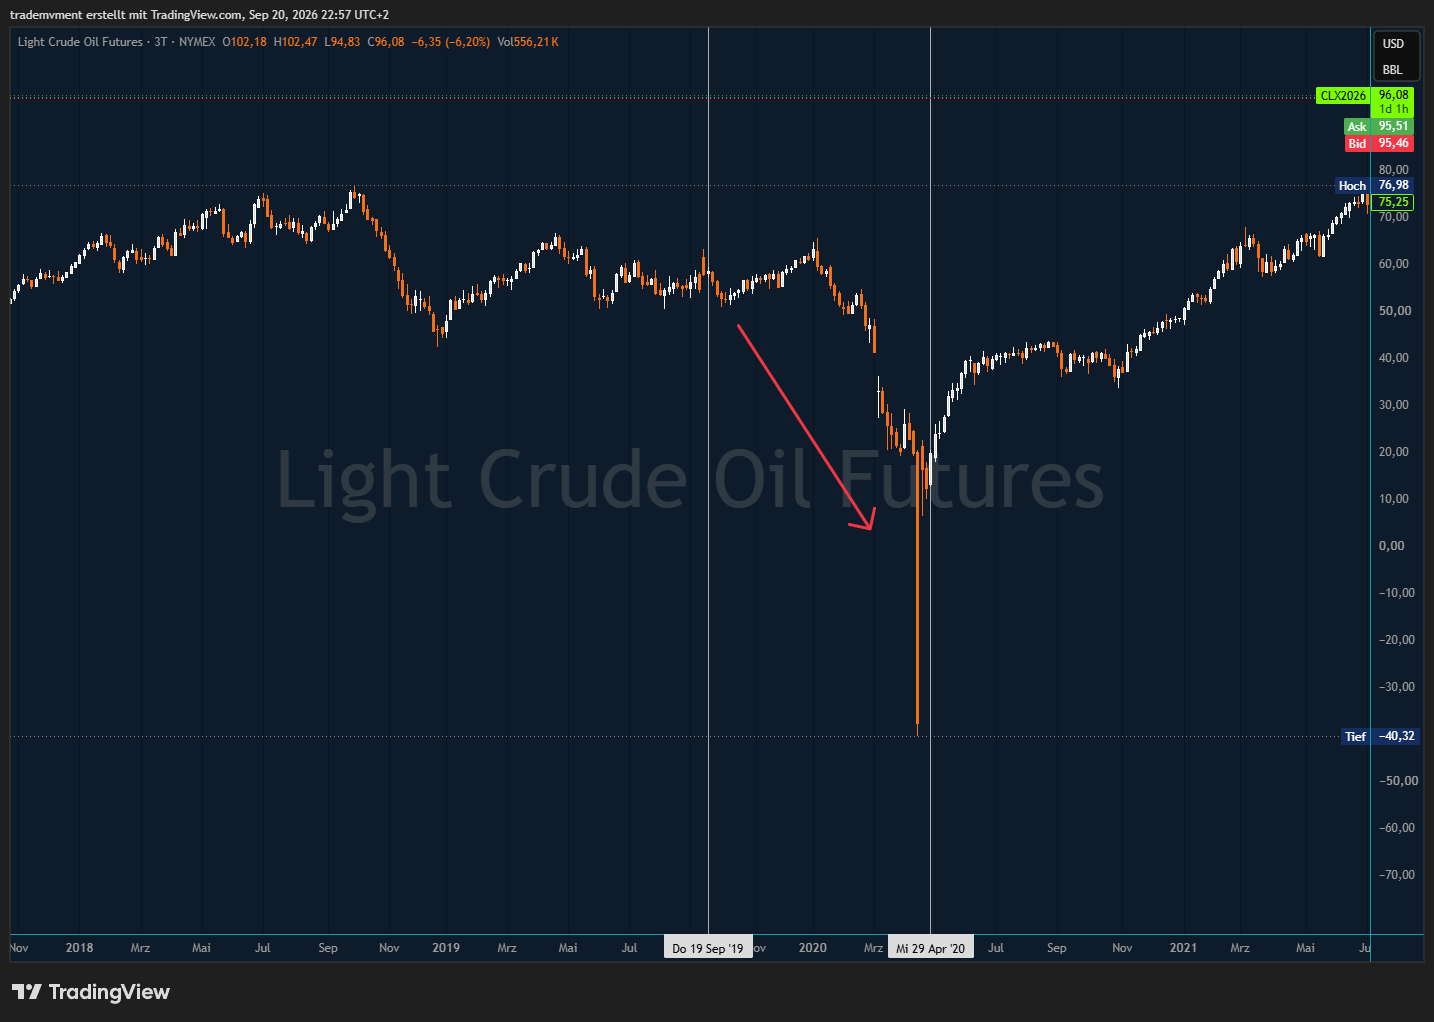
The circumstances were much more extreme. The underlying principle, however, was similar:
If oil demand falls faster than supply can adjust, prices can decline much more sharply than the market initially expects.
4. Positioning
The current CoT structure shows similarities to positioning behaviour during the decline of 2008.
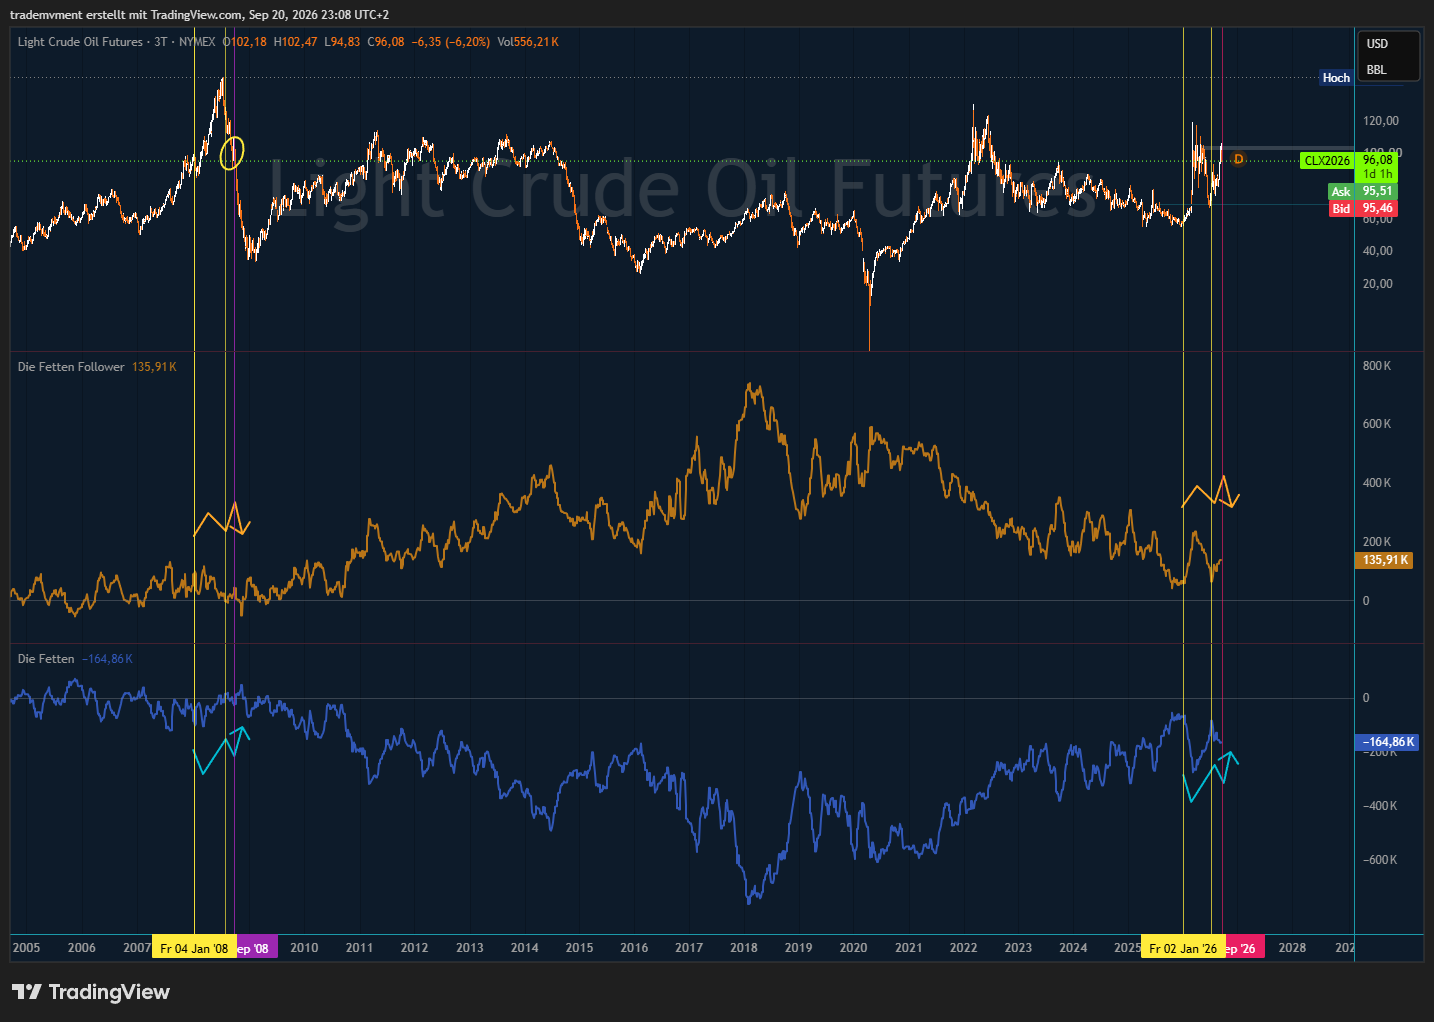
- Producers and hedgers remain heavily net short.
- Trend followers still hold substantial long exposure.
- Oil prices remain elevated despite increasing macroeconomic risks.
This creates a vulnerable positioning structure.
If the economic environment deteriorates further and price action confirms my macroeconomic thesis, the unwinding of speculative long positions could accelerate the decline.
I do not use CoT data as a precise timing signal.
It serves as confirmation that the market could become vulnerable once the dominant narrative shifts from supply scarcity towards demand destruction.
5. Seasonality
Oil is approaching a seasonally vulnerable window between late September and November.
September itself has historically been mixed and should not be described as inherently bearish.
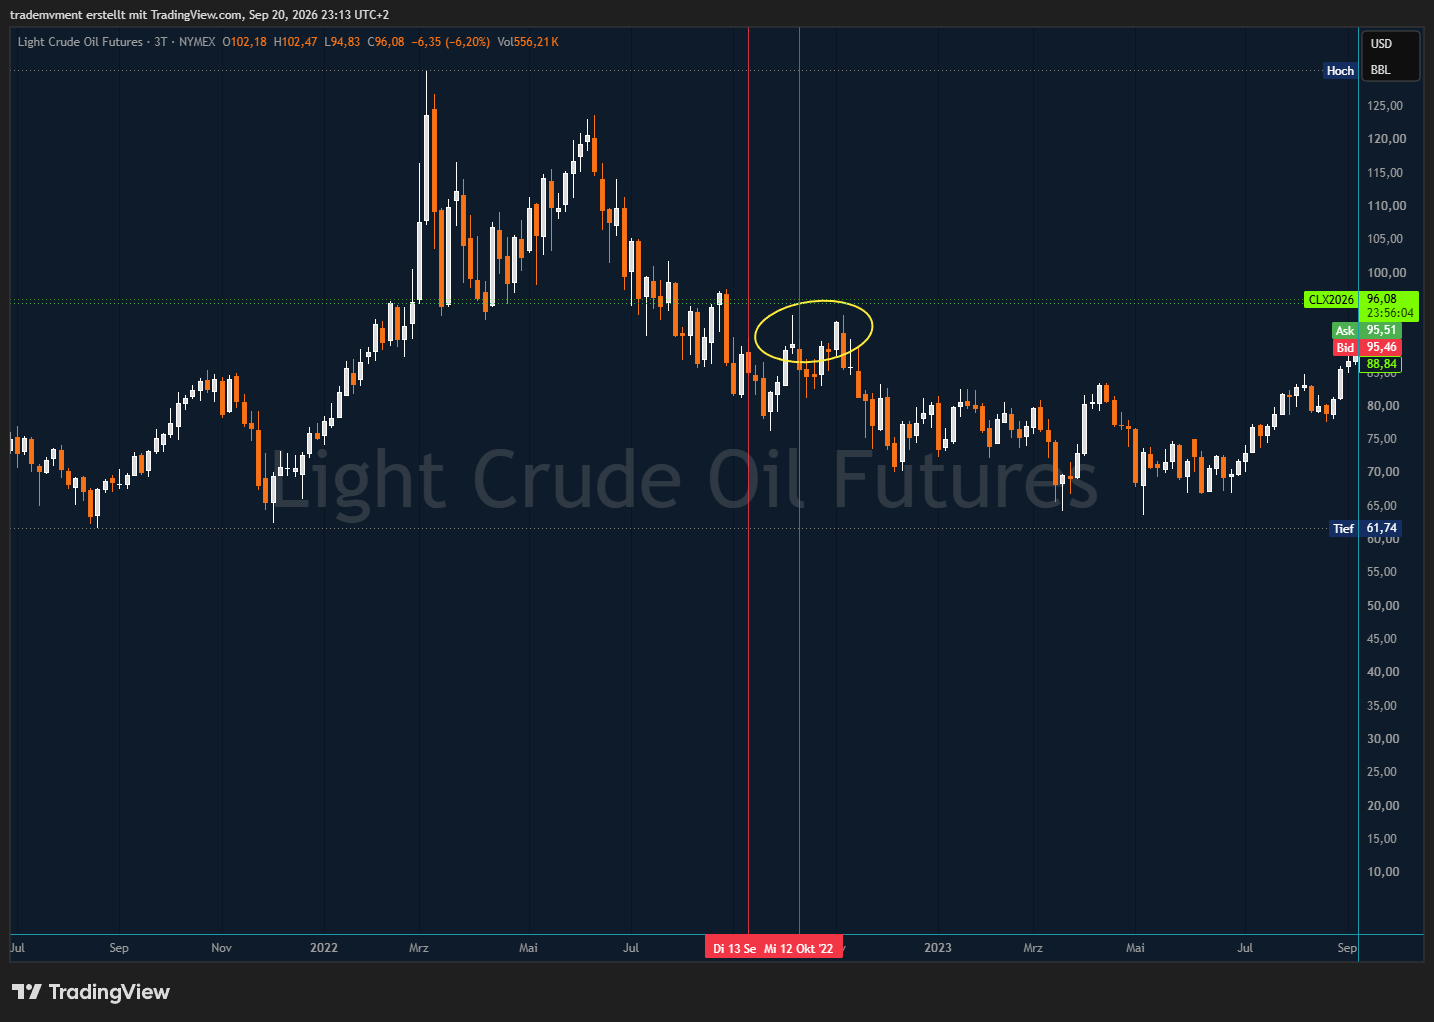
Several years with significant macroeconomic stress nevertheless saw pronounced September declines:
- 1988: approximately −11.92%
- 2000: approximately −6.77%
- 2008: approximately −13.18%
- 2022: approximately −10.27%
In 2008, the September decline was followed by a further drop of approximately 32.95% in October.
The seasonal data in the chart show average returns of approximately:
- September: +1.29%
- October: −1.98%
- November: −3.02%
Only around 34% of the November months shown closed higher.
Seasonality is not the reason for entering the trade.
It supports the broader macroeconomic bias and shows that the expected weakening in demand falls within a historically vulnerable period.
6. Technical execution
The macroeconomic framework determines the direction of the trade.
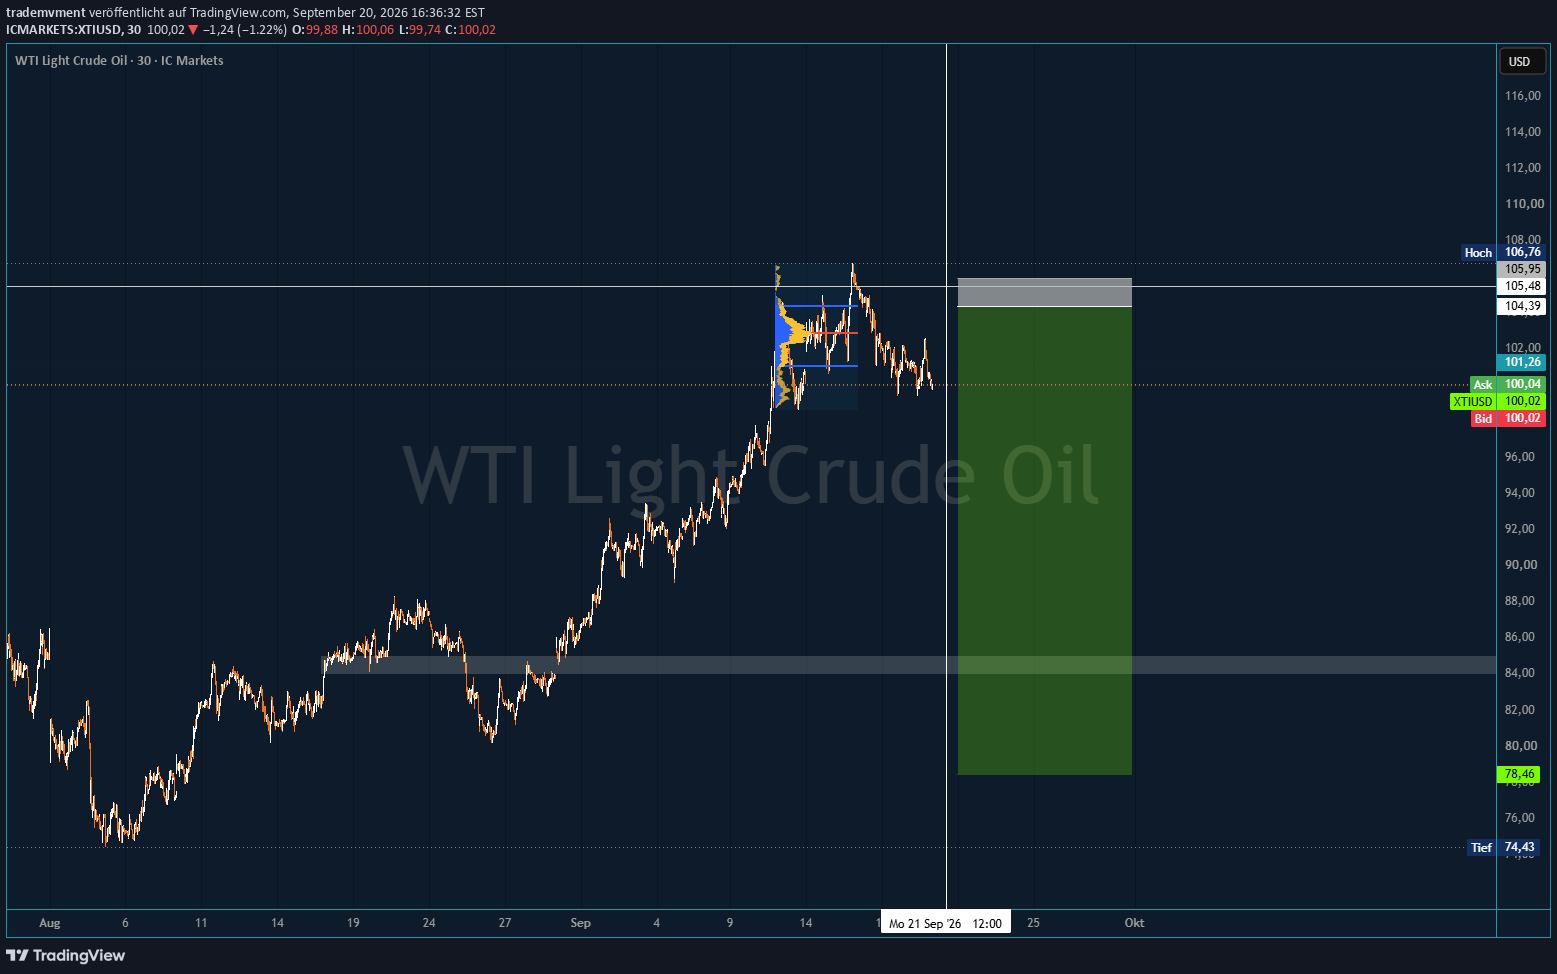
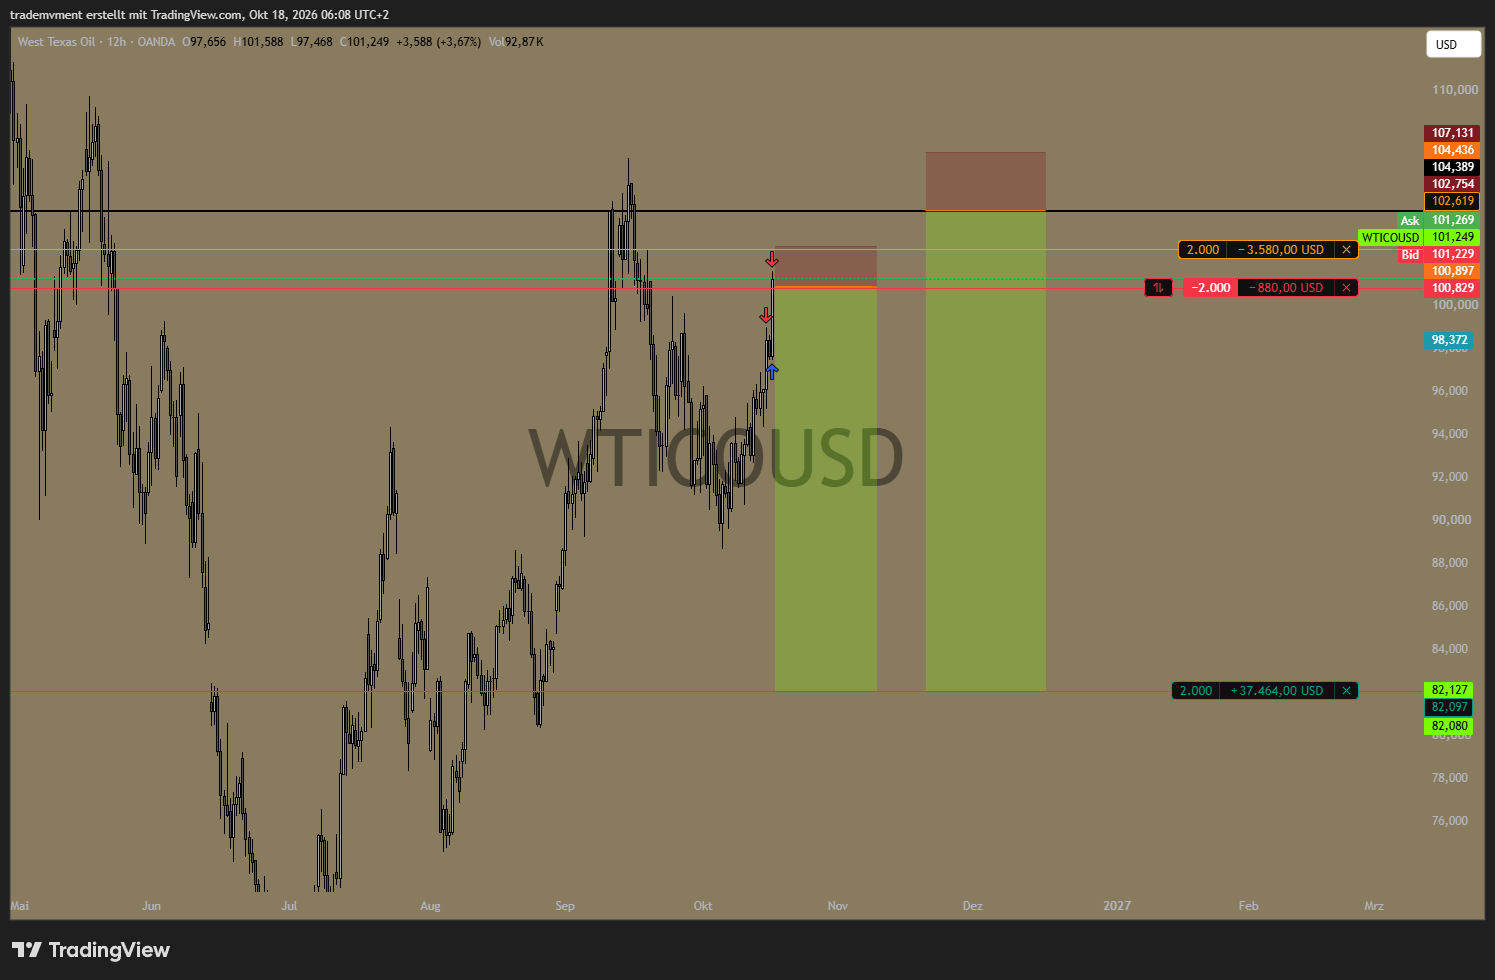
The entry itself is based exclusively on the upper area of the current volume profile.
I am not selling at the current market price.
With volatility still very high, I consider another sharp move towards the recent highs possible.
Planned entry area:
Sell Limit
This area lies in the upper part of the previous consolidation and its associated volume distribution.
A short-term move into the $104–106 area would not automatically invalidate the broader thesis.
It could simply represent a renewed repricing of geopolitical risk.
Technical execution:
The limit order requires the market to return to the upper volume area first.
I continue to expect high volatility, but I do not currently expect a sustained breakout above the existing highs.
The first target lies at the previous structural demand zone.
The extended target represents the possible scenario in which the market shifts fully from a geopolitical supply narrative towards global demand destruction.
What would invalidate the thesis?
- a further significant escalation in geopolitical supply risks
- additional and prolonged disruptions to important production capacity
- sustained acceptance above the existing highs
- significantly stronger global economic activity than expected
- renewed acceleration in global oil demand
- extensive production cuts that fully offset falling demand
The geopolitical risks do not need to disappear completely for this thesis to work.
The supply situation must simply avoid deteriorating faster than global demand declines.
Summary
This setup is based on the combination of:
An elevated geopolitical risk premium + weaker global growth + restrictive monetary policy + potential demand destruction + vulnerable speculative positioning + bearish seasonality towards year-end
The supply shock caused the initial rise in oil prices.
The economic and monetary consequences of that shock, however, could ultimately become the reason oil prices fall.
The fundamental framework defines the directional bias.
The actual entry is determined by the upper area of the volume profile.
This is not a short-term news trade or a trading signal. It is a macro swing thesis spanning several weeks, with a predefined entry, clear invalidation and defined target areas.
Disclosure: I hold or intend to hold a short position in WTI crude oil. This post documents my personal market thesis and does not constitute individual investment advice.
Dated updates
Progress update ·
Following
Position checkpoint — 18 October 2026
The supplied chart and broker snapshot document an open WTI short. Both original images are attached; each records the values and sizing shown at its own capture time.
Fundamental context — EIA outlook released 6 October 2026
The EIA raised its fourth-quarter Brent forecast to $105 per barrel, $14 above its September outlook, citing continuing supply disruptions and inventory drawdowns. Its forecast still envisages easing prices as export routes recover. My reading for the WTI short is that actual normalization of oil flows matters: persistent supply constraints are an opposing risk.
Source: EIA — October 2026 Short-Term Energy Outlook, pages 3–6.

After · final review ·
Closed
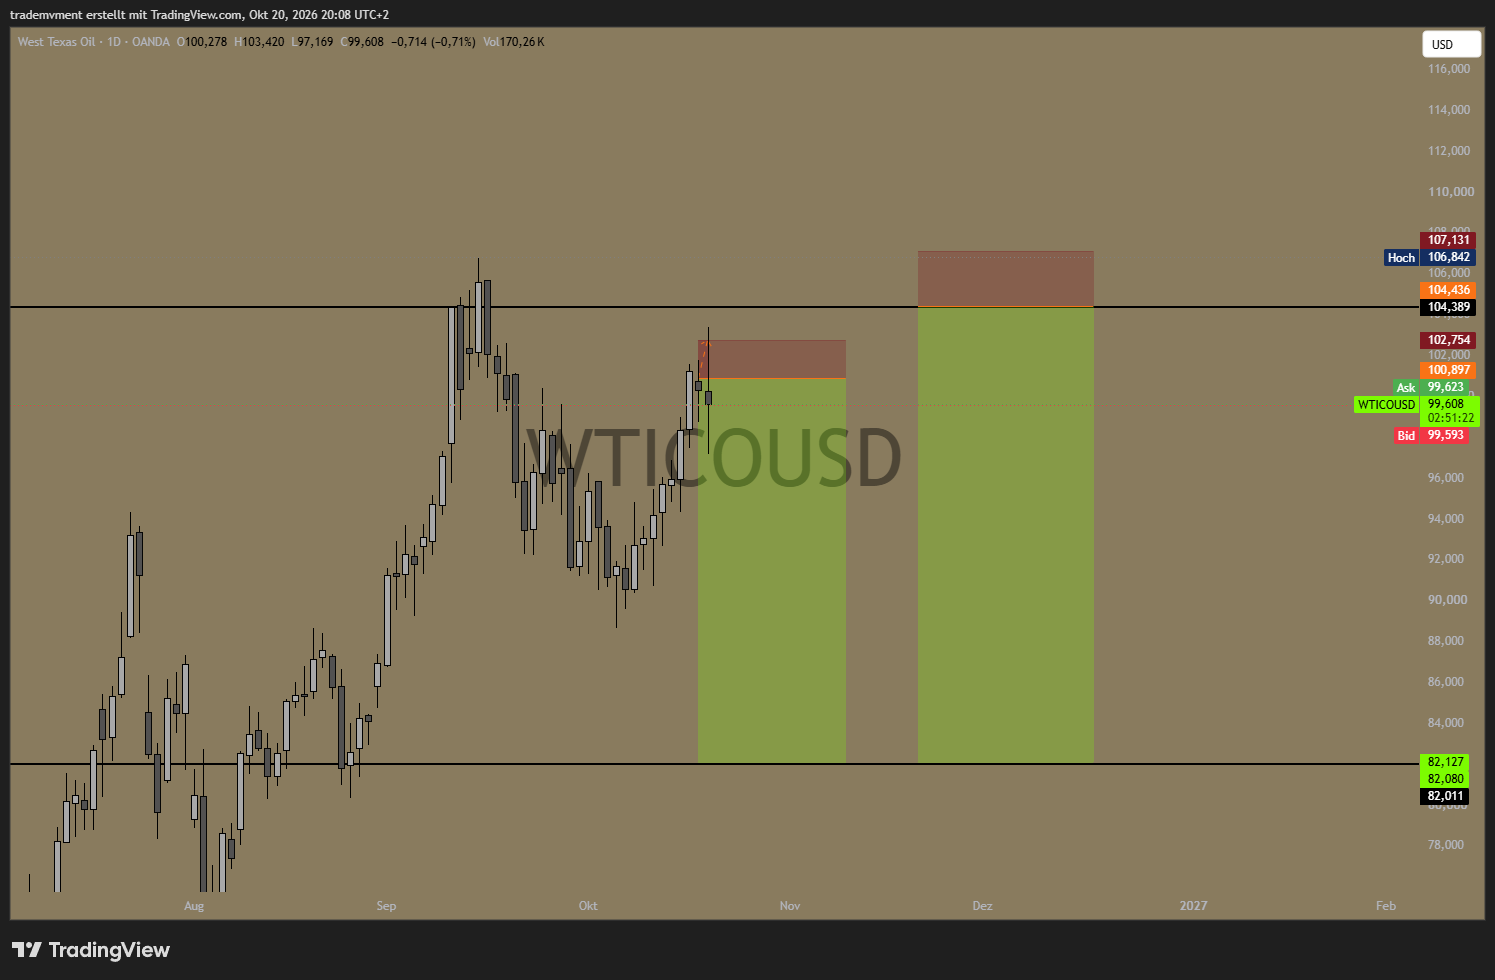
Stop-loss hit — 20 October 2026
My stop-loss was hit, closing the WTI short position. The updated TradingView chart is attached below.
Loading comments…