Copper (HG1!) Short — Macro Setup, 1–2 Months
Original analysis
English edition of the original analysis by trademvment. Original TradingView publication ↗
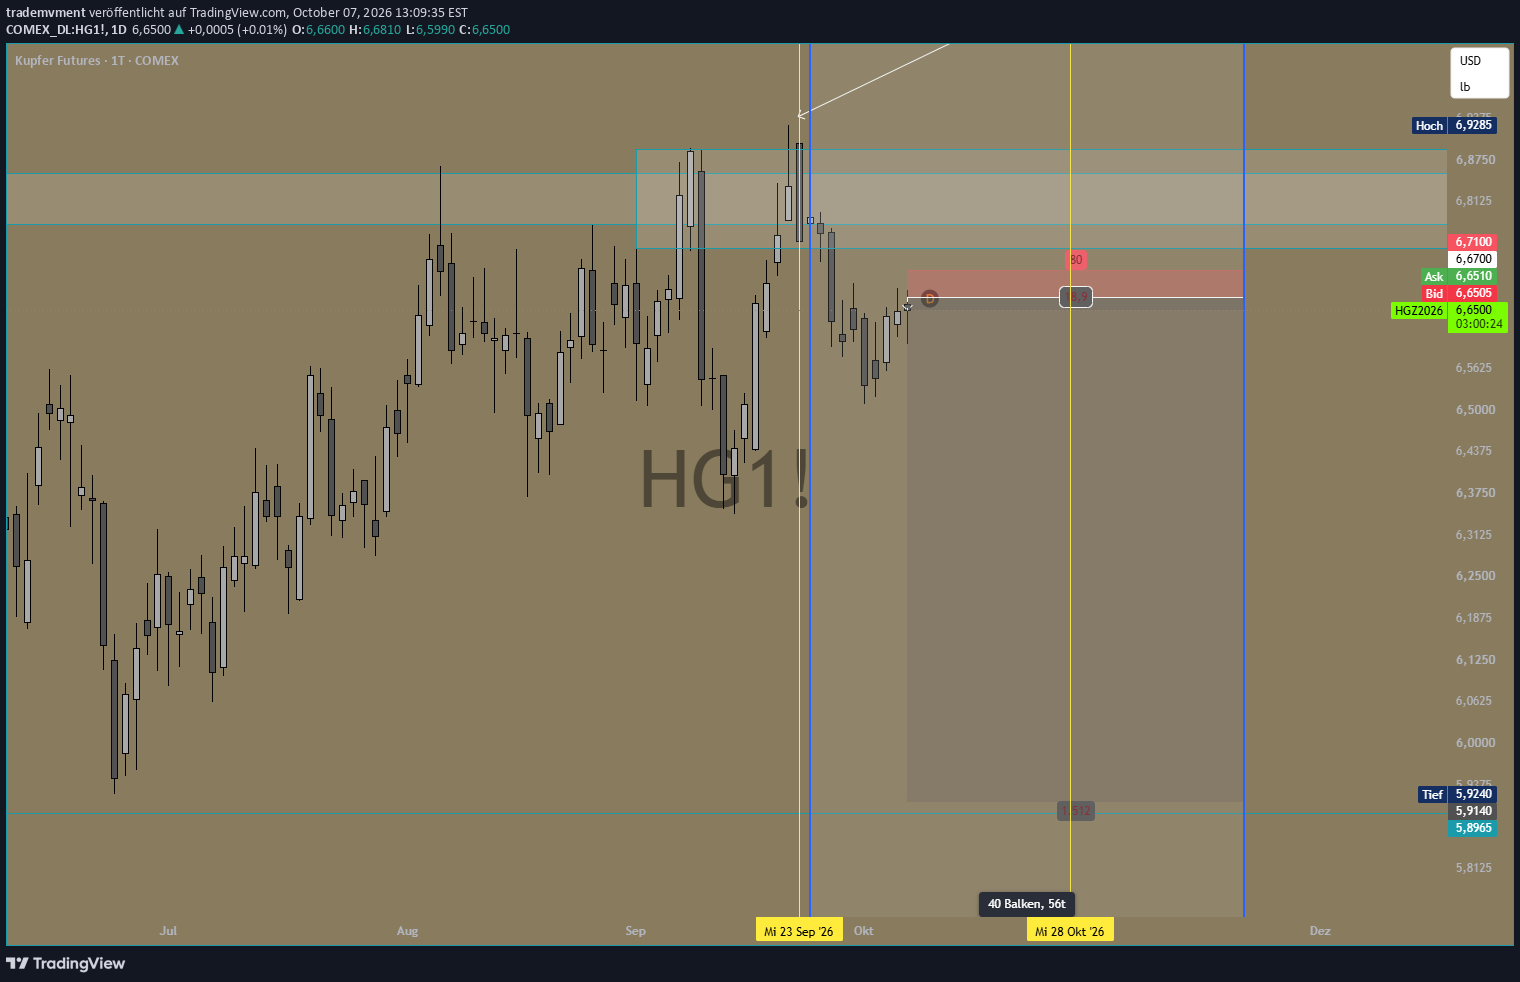
Stop correction — 19 October 2026
The stop shown in the chart images was incorrect. The actual initial stop distance was 300 ticks. This correction was supplied when the original analysis was added to Melvin Markets. The original chart artwork is preserved unchanged.
Original analysis — 7 October 2026
Time horizon: 1–2 months | As of: 7 October 2026
COMEX:HG1!
I see the possibility of a correction in copper following the recent rally. My thesis combines a notable October window, recurring positioning patterns and the risk that demand falls short of expectations.
1. Seasonality: A notable October
In the four-year selection shown, October was negative in 11 of 15 cases. The average monthly loss is around 3%.
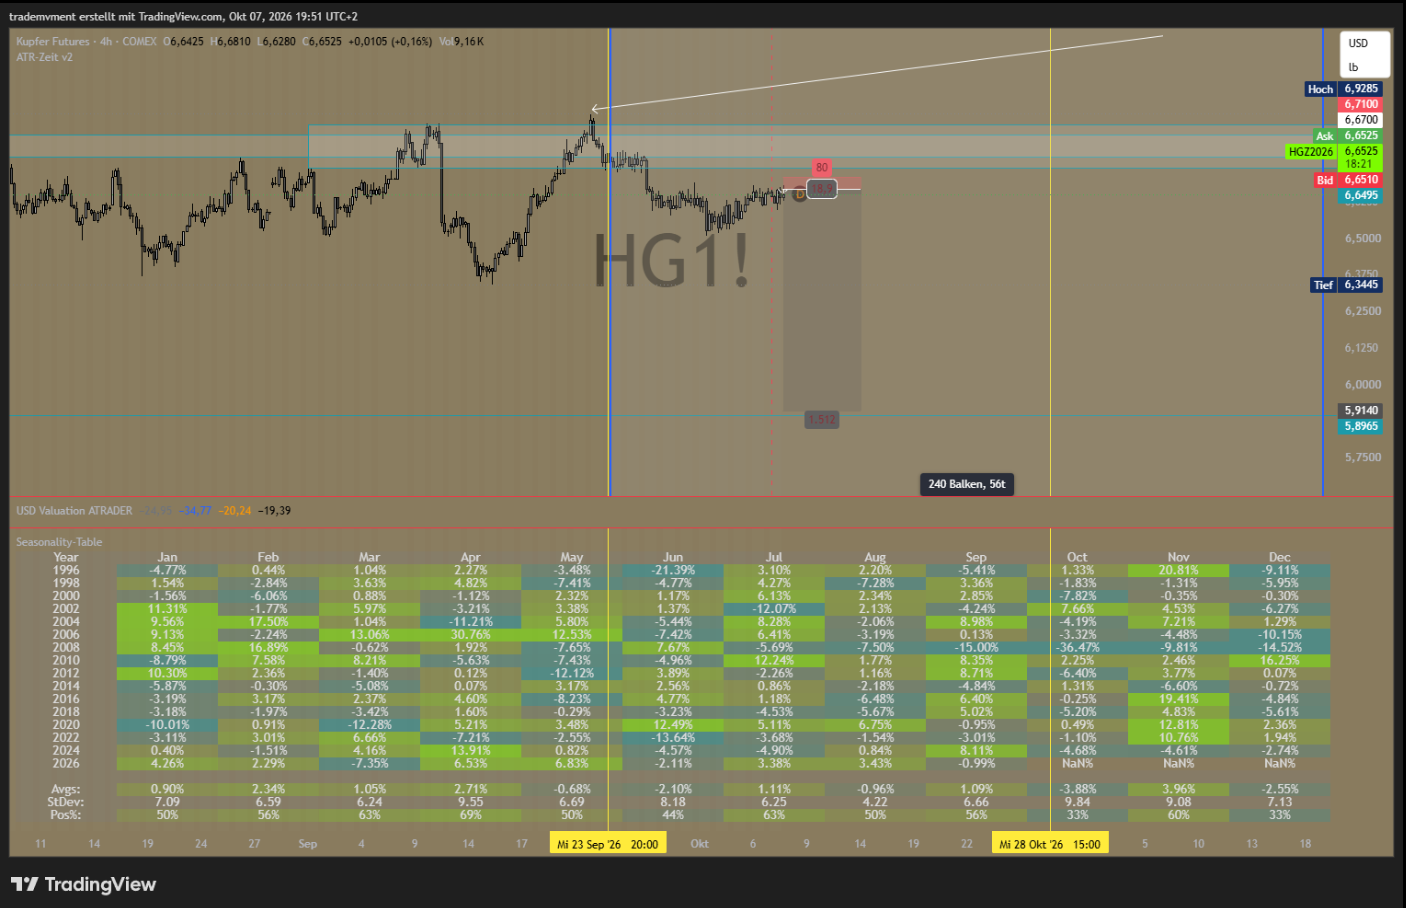
The supplementary seasonal chart helps me compare the marked window from late September to late October with the actual price structure. The comparison becomes relevant to my short thesis if copper fails to sustainably reclaim the upper zone and then forms lower highs.
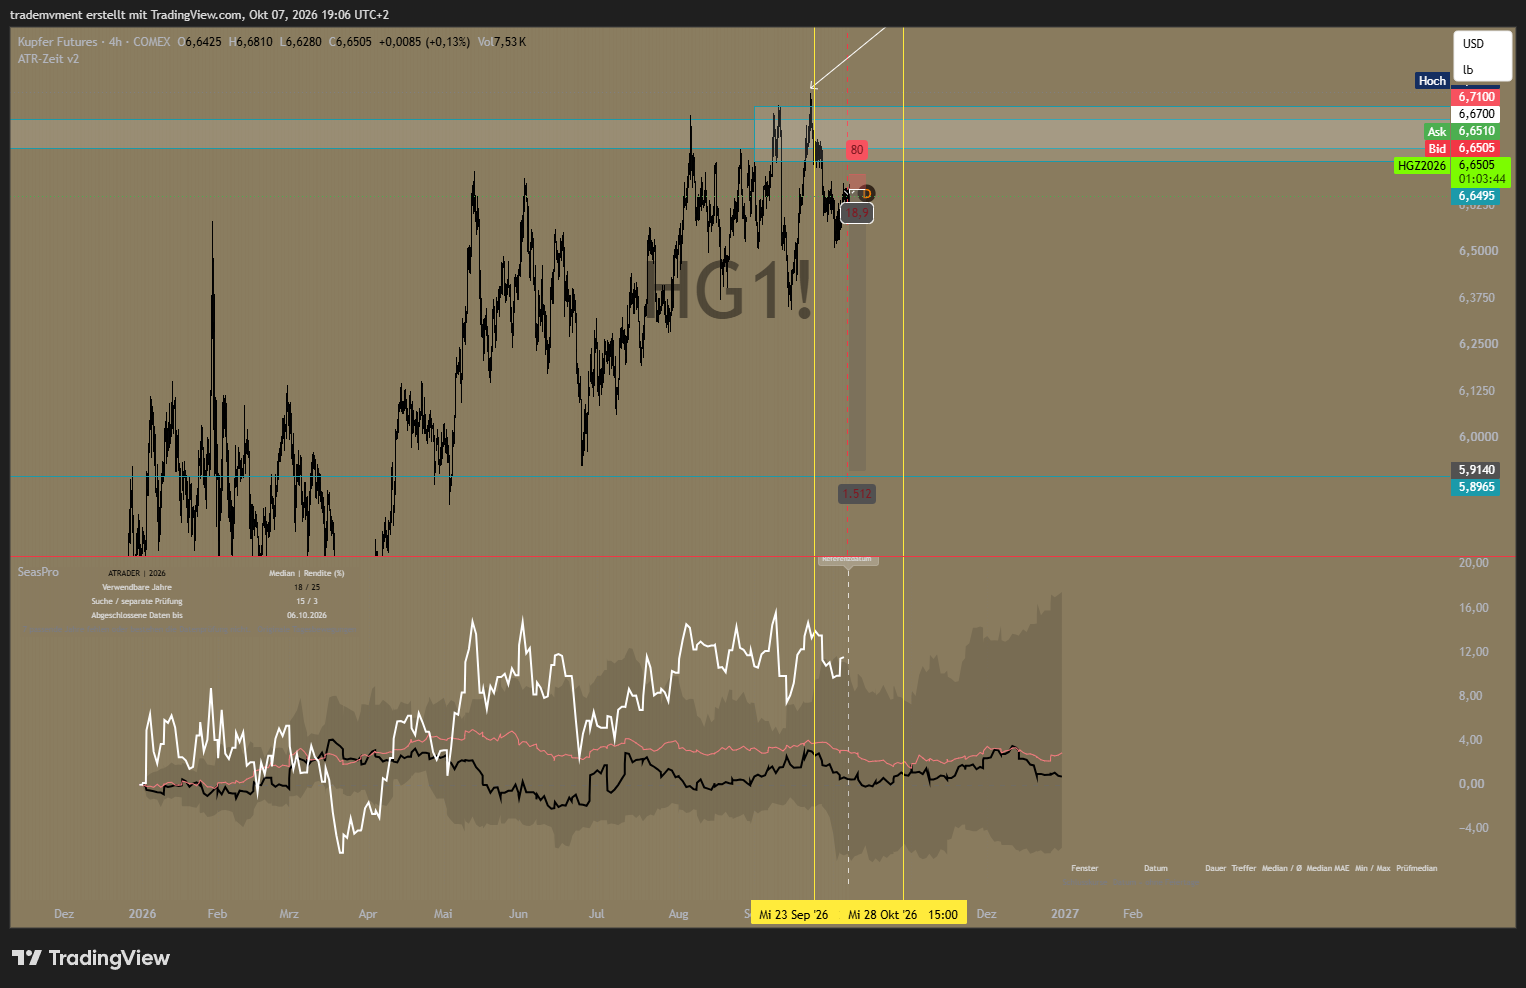
2. COT: What I infer from positioning
Non-Reportables: Renewed long accumulation after a decline
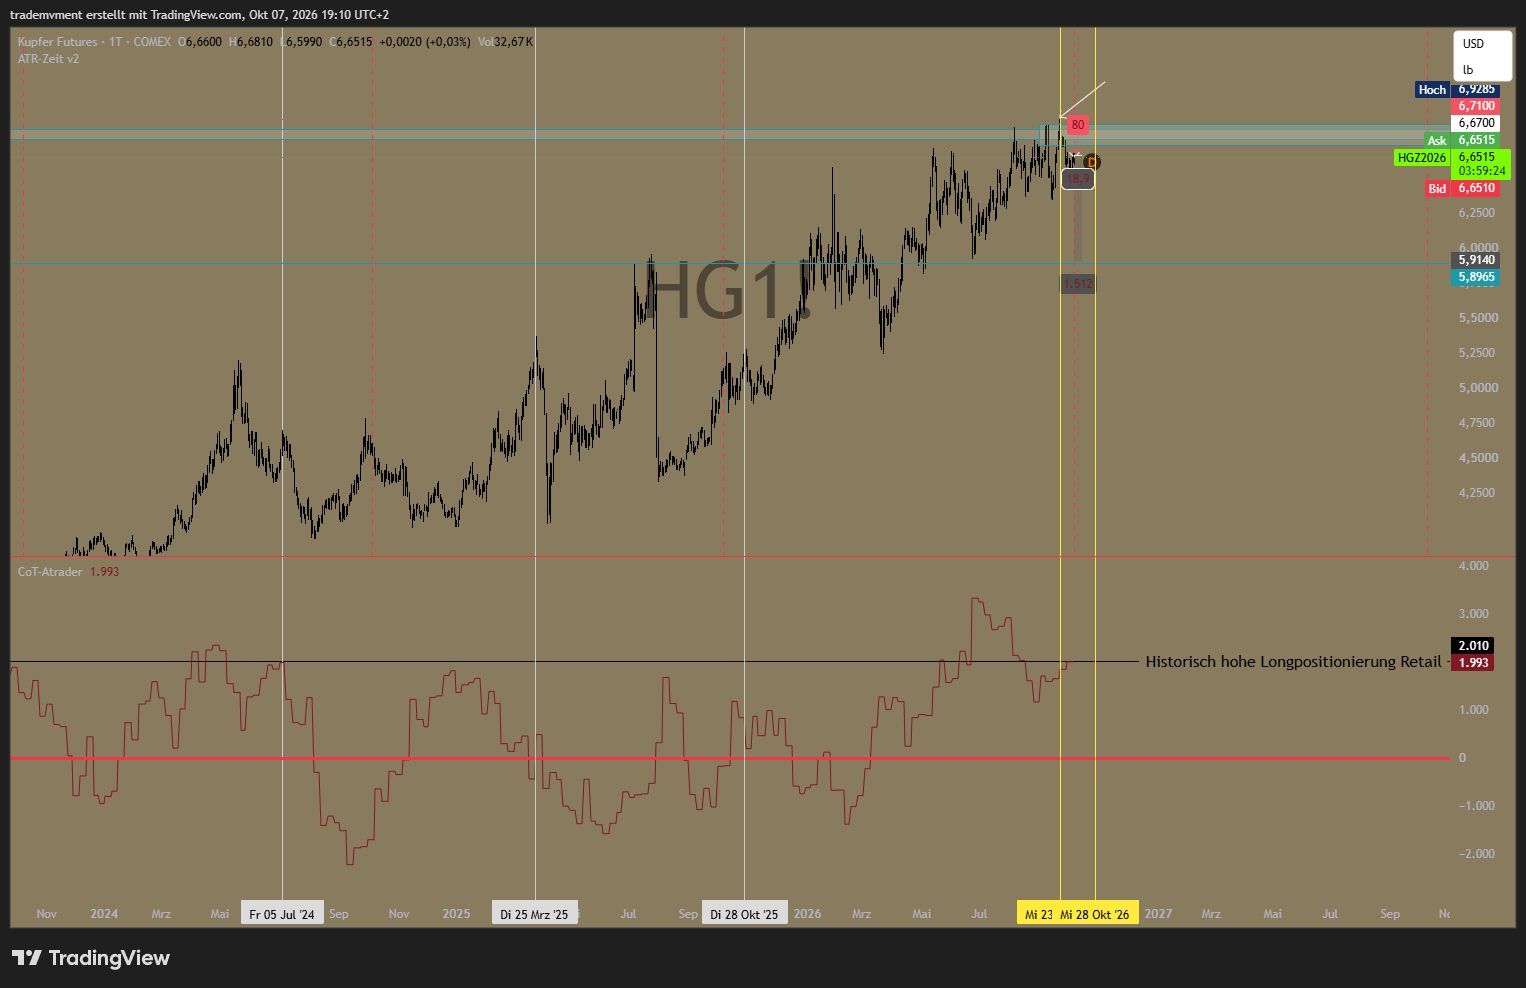
The high positive net positioning stands out in the indicator series shown. Following the larger peak in summer, it was initially reduced and has recently been built up again. The latest reading is, however, below that previous peak.
I am particularly interested in the combination of already positive net positioning, renewed long accumulation and a slowing upward price move. If additional positions no longer move the price forward, the long side can become more vulnerable to a pullback.
Here, I place more weight on the visible alternation between accumulation, reduction and renewed accumulation.
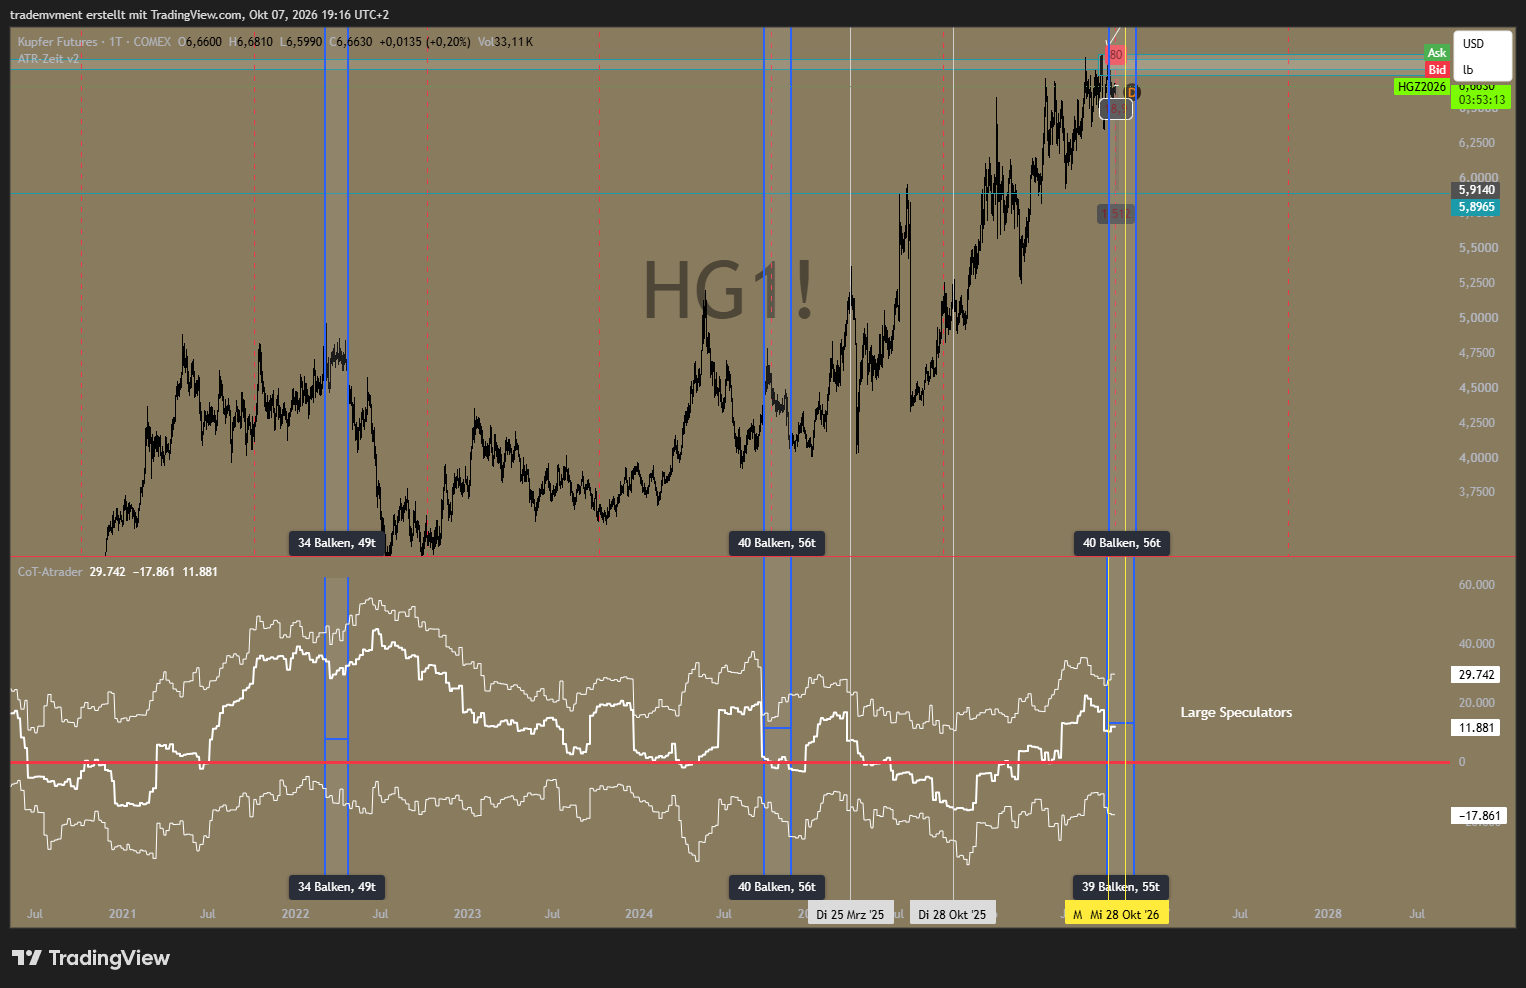
Large speculators: Similarities with 2022 and 2024
The marked areas remind me of the positioning changes before or during the corrections in 2022 and 2024. In the series shown, the net long position became smaller at times while both long and short holdings changed. Recently, stronger short accumulation compared with the previous phase stands out again.
The relationship matters: If both sides increase, the net long position can still decline if shorts increase more strongly.
The official futures-only report for 29 September 2026 still shows Non-Commercials at +85,411 contracts net long. In that reporting week, long holdings fell by 6,093 and short holdings by 982 contracts. The decline in the net long position was therefore mainly driven by a reduction in longs.
That is consistent with weaker long positioning.
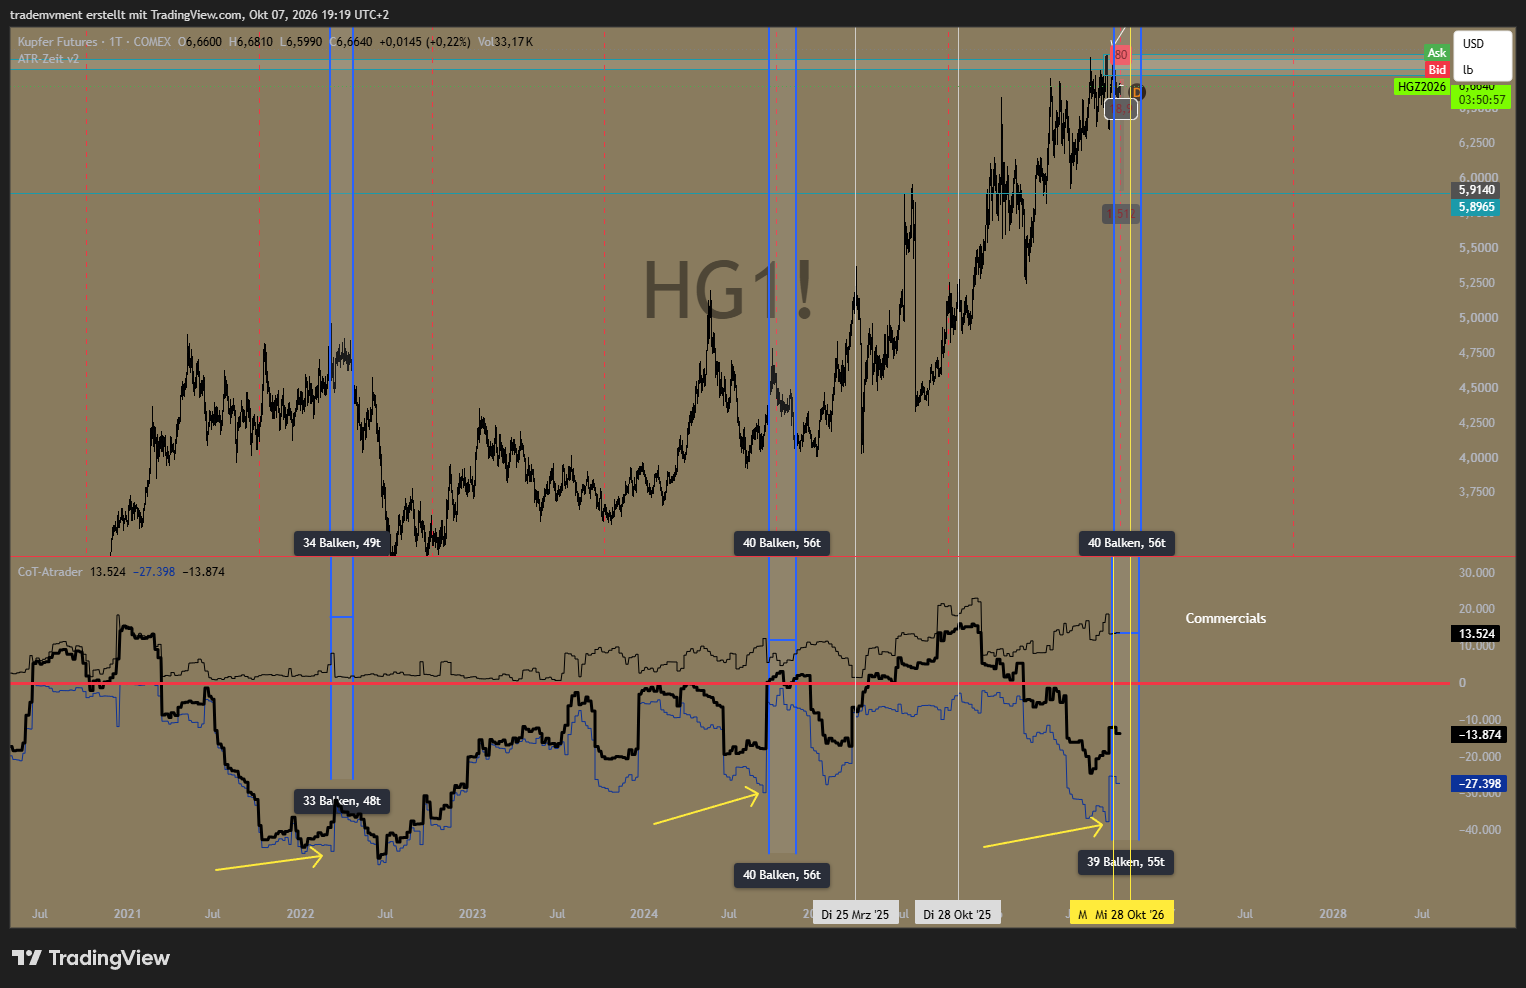
Commercials: A notable reduction in short holdings
The yellow arrows mark sharp reductions in Commercial short holdings. Similar changes are marked in the comparison areas for 2022 and 2024. The long side changes significantly less in the most recently marked section.
The official weekly comparison for 29 September also shows this direction: Commercial shorts fell by 5,373 contracts, while longs increased by 221 contracts.
3. My interpretation: Risk of long liquidation
My theory starts with the subsequent price behaviour: If copper fails to reach sustainable new highs despite the reduced Commercial shorts, I would take that as a sign of fading strength.
If further selling of existing long positions and stronger speculative short accumulation then follow, the correction could accelerate. I would only call it a long squeeze if positions were forcibly unwound because of losses or margin pressure.
I see a possible sequence here.
4. China and interest rates: How resilient is demand?
In September, China's Manufacturing PMI stood at 50.1, the production index at 51.7 and the production and business expectations index at 53.8. These readings are above the expansion threshold of 50. At the same time, new orders in construction remained below it at 45.7; property activity was also weak.
As in other analyses, I am speculating on further weakness (subjective assessment).
For my short thesis, the relevant risk is therefore an uneven recovery and weak demand from individual areas. These data do not confirm a general decline in Chinese production, and I would not recommend that anyone use that as a reference point. For me, these are simply developments relating to a theory I have been following since Q1–Q2.
Several major central banks are keeping financing tight: The Fed raised its target range to 3.75–4.00% on 16 September, and Australia's RBA raised its policy rate to 4.60% on 29 September.
My inference: More expensive financing can weigh on construction projects, investment and inventories. If activity weakens as a result, that would be an additional headwind for copper demand. The coming data will have to show how strong this effect is.
5. AUD and copper: Shared drivers
I watch the Australian dollar as a supplementary signal. Australia's commodity exports connect the AUD with export prices, growth among major trading partners and market risk appetite. Copper also responds to expectations for industrial demand.
AUD/USD and copper can therefore respond to similar economic impulses. However, other commodities and the expected interest-rate differential with the US also matter for the AUD!!!
Australia's unemployment rate rose to 4.6% in August. At the same time, employment increased by around 39,000 people and participation rose. The labour market therefore does not yet show a uniform signal of collapse. But the signals remain very mixed.
If it weakens further and inflation pressure eases sufficiently, expectations of rate cuts could emerge. Expected easing relative to the US could weigh on AUD/USD. At present, however, the RBA has just raised rates again. Rate cuts are a possible later scenario here and, for me, more a part of a thesis (subjective).
For my copper thesis, AUD weakness would be particularly relevant if Chinese demand indicators and the copper price were falling at the same time. If the AUD moves mainly because of Australian interest-rate policy, it is less informative about copper.
It is the clockwork with all its gears, rather than just one that confirms the reasoning to reinforce the feeling.
6. The scenario I am following
My bias remains bearish for the next 1–3 months. I am following the scenario in which the rally fails at the upper marked zone, the upward structure weakens and further long liquidation reinforces the correction.
The following would support the thesis:
I work with historical comparisons and an interpretation of positioning. Price must confirm whether this actually develops into a tradable sell-off.
I trade based on feeling and my assessment of what I believe I can understand and interpret. I do not trade according to a strategy.
P.S. Certain patterns recur. Their timing and effect have to be assessed afresh each time.
English translation of the complete original publication of 7 October 2026, with a separately dated owner correction to the stop distance. The original German source, differing time horizons and unfinished supporting-points heading are preserved; no missing arguments have been added.
Dated updates
Progress update ·
Following · stop at break-even
Position update — 19 October 2026
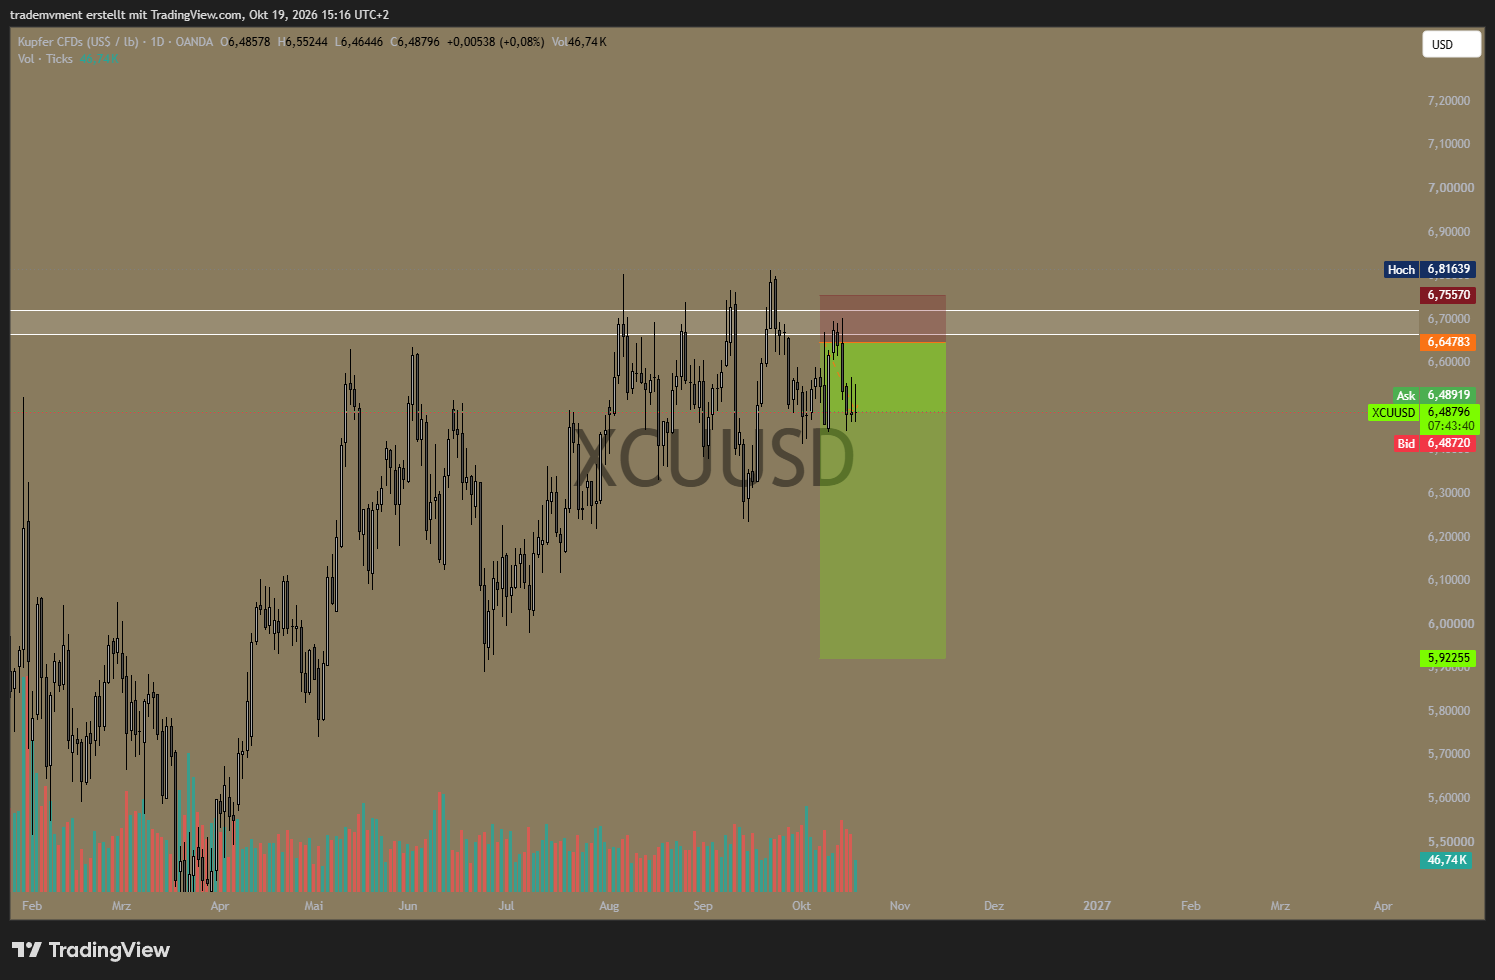
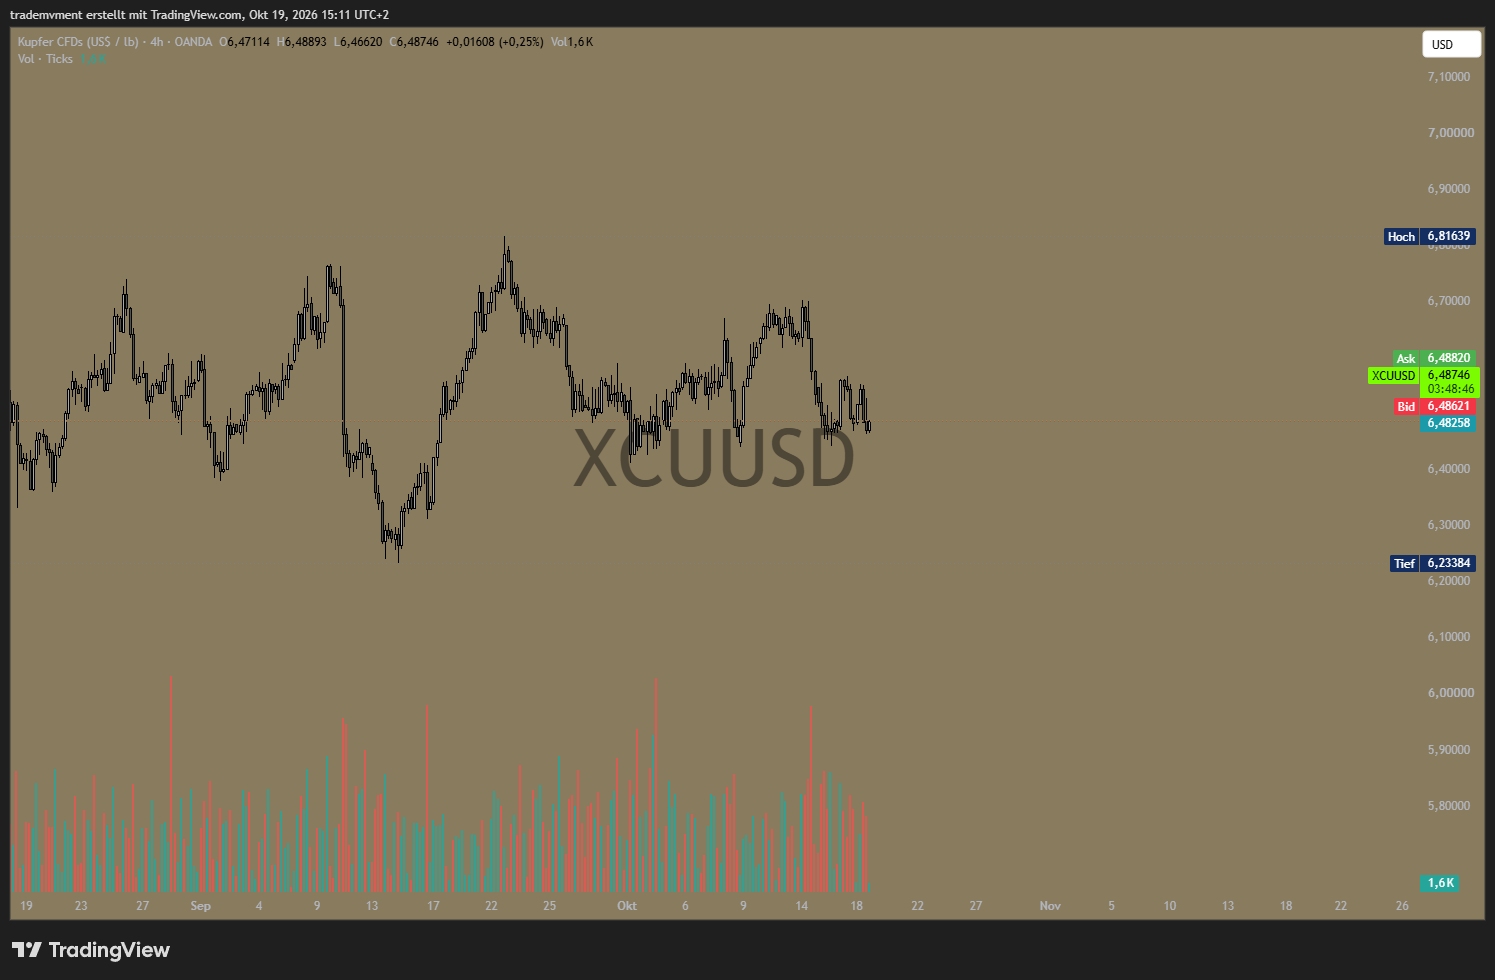
The copper short remains open. I have moved the stop to break-even and am letting the trade continue to run. The current daily TradingView chart and the four-hour chart supplied with this update are attached below.
Correction to the chart images: The stop shown in the chart images was incorrect. The actual initial stop distance was 300 ticks. The stop has now been moved to break-even. The original images are preserved unchanged.
Loading comments…