Sugar Short Setup — 7 October 2026: Macro
Original analysis
English edition of the original analysis by trademvment. Original TradingView publication ↗
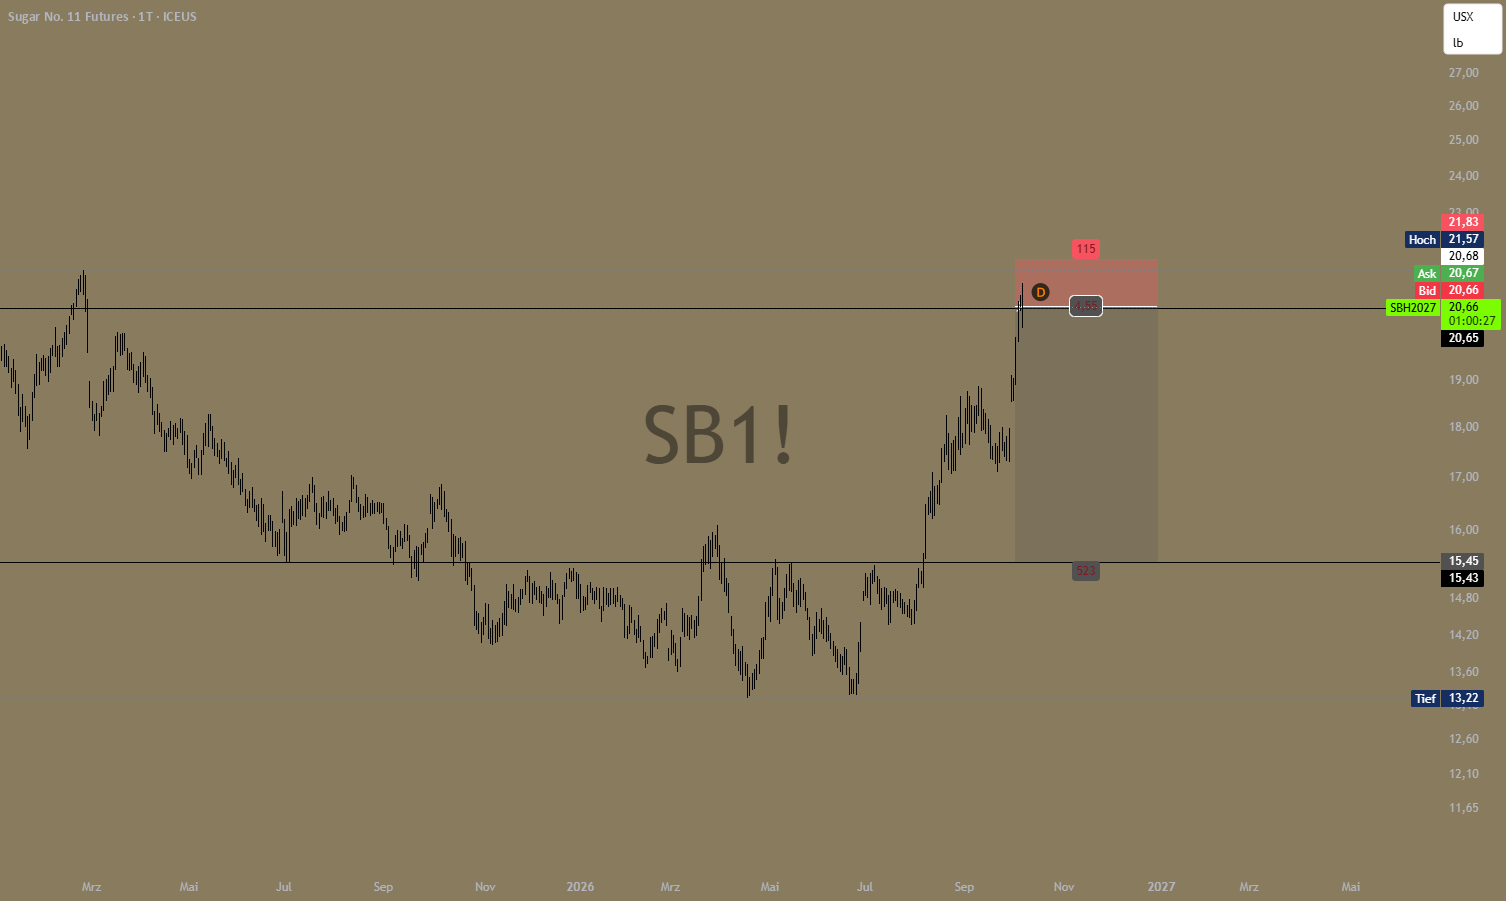
Time horizon: 1–3 months
I see the possibility of a correction in sugar's recent rally. My thesis rests on the seasonal window, the pronounced shift in positioning and potential pressure through the oil/ethanol market.
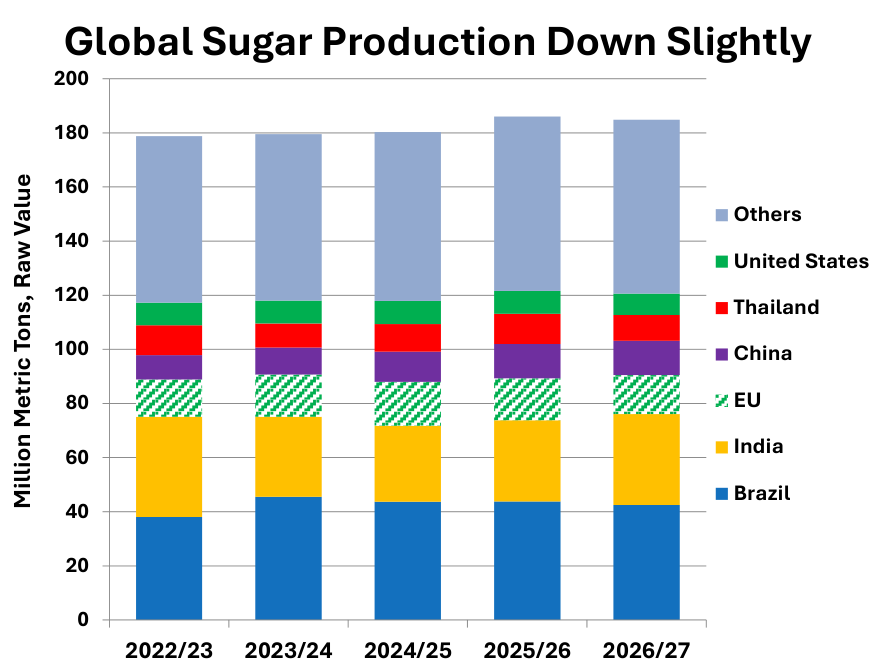
For agricultural commodities, I do see bullish potential in the coming year due to weather and supply problems. At the same time, a bearish window may emerge over the next one to three months. The time horizon is crucial here.
1. El Niño: Weather risk and the price response
I do not know how strongly El Niño will ultimately affect the sugar harvest. I am not a storm chaser, and I do not have a crystal ball either.
El Niño changes large-scale precipitation and temperature patterns. The consequences depend on the growing region, the season and the plants' stage of development. Additional rain can help in some regions but disrupt harvesting elsewhere. Drought can weigh on yields.
A seasonal weather forecast therefore does not provide a finished harvest volume. For prices, what also matters is how far the actual outcome differs from expectations already priced in. Therefore, it is not relevant to me.
I take weather risks seriously. For my short-term timing, however, I give greater weight to seasonality, positioning and price behaviour.
2. Seasonality: October through year-end
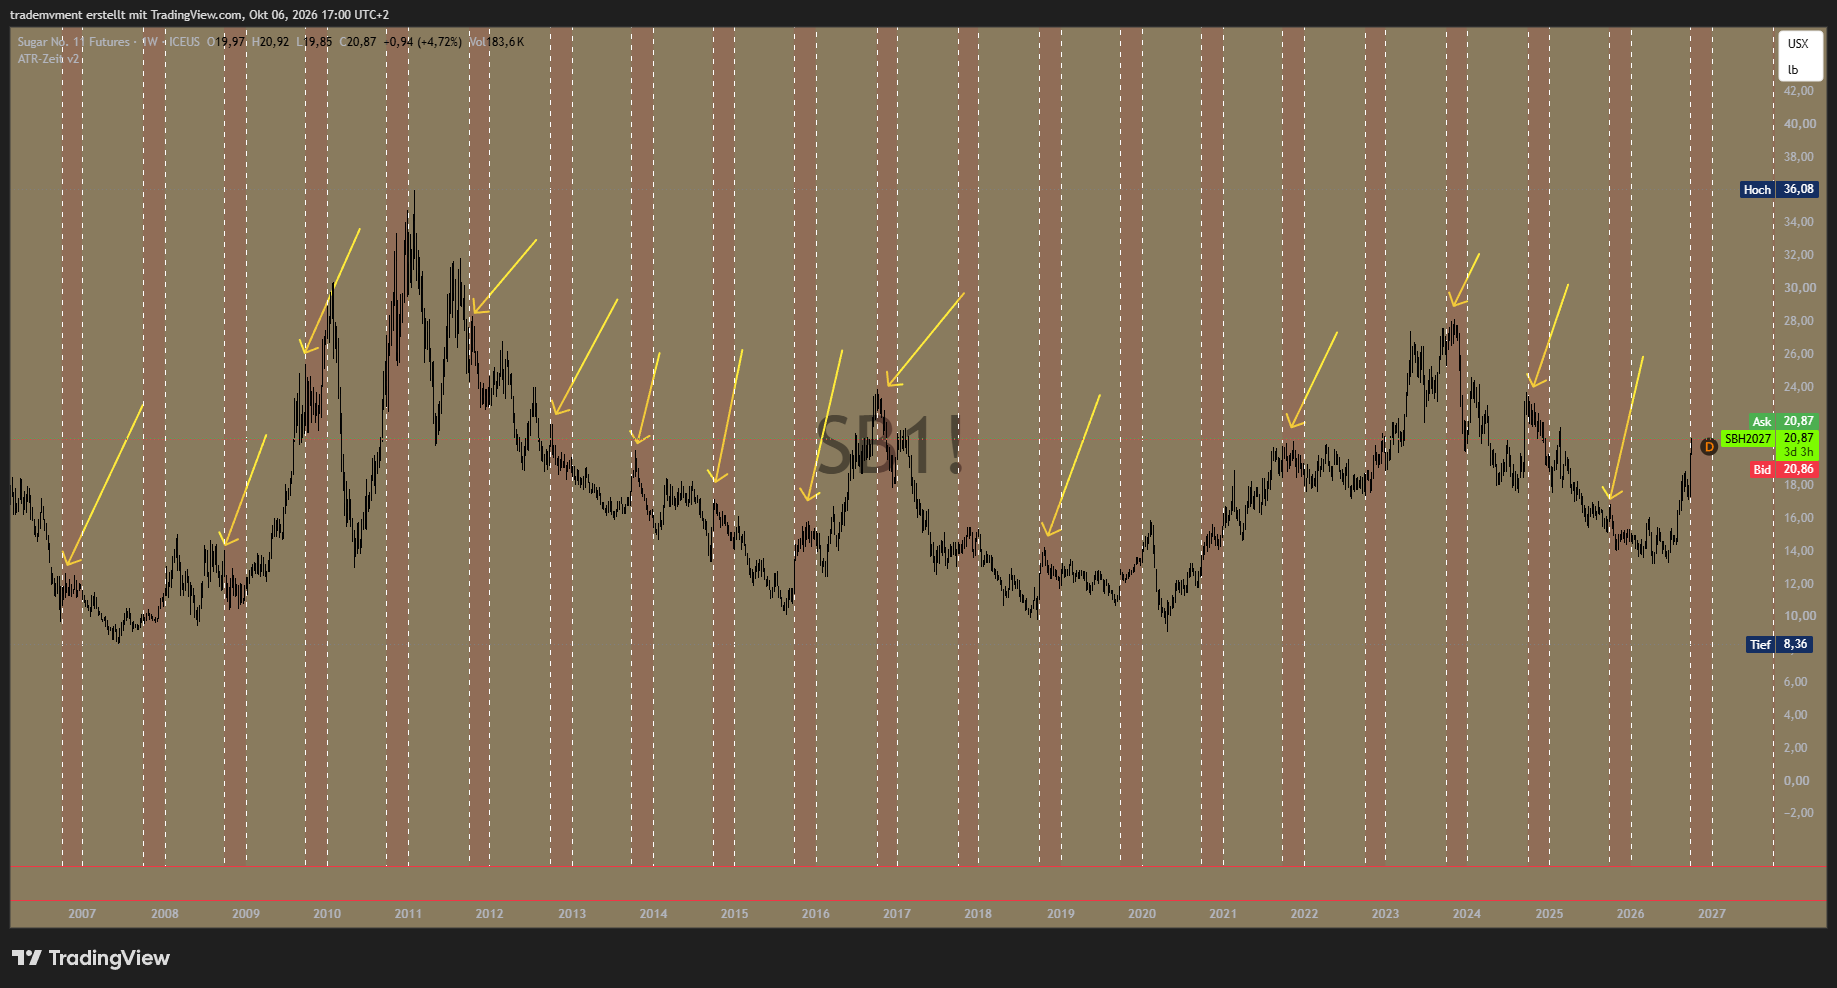
According to my evaluation, sugar fell in 14 of the 20 October-to-year-end windows examined.
3. Historical comparison: October 2013 through summer 2015
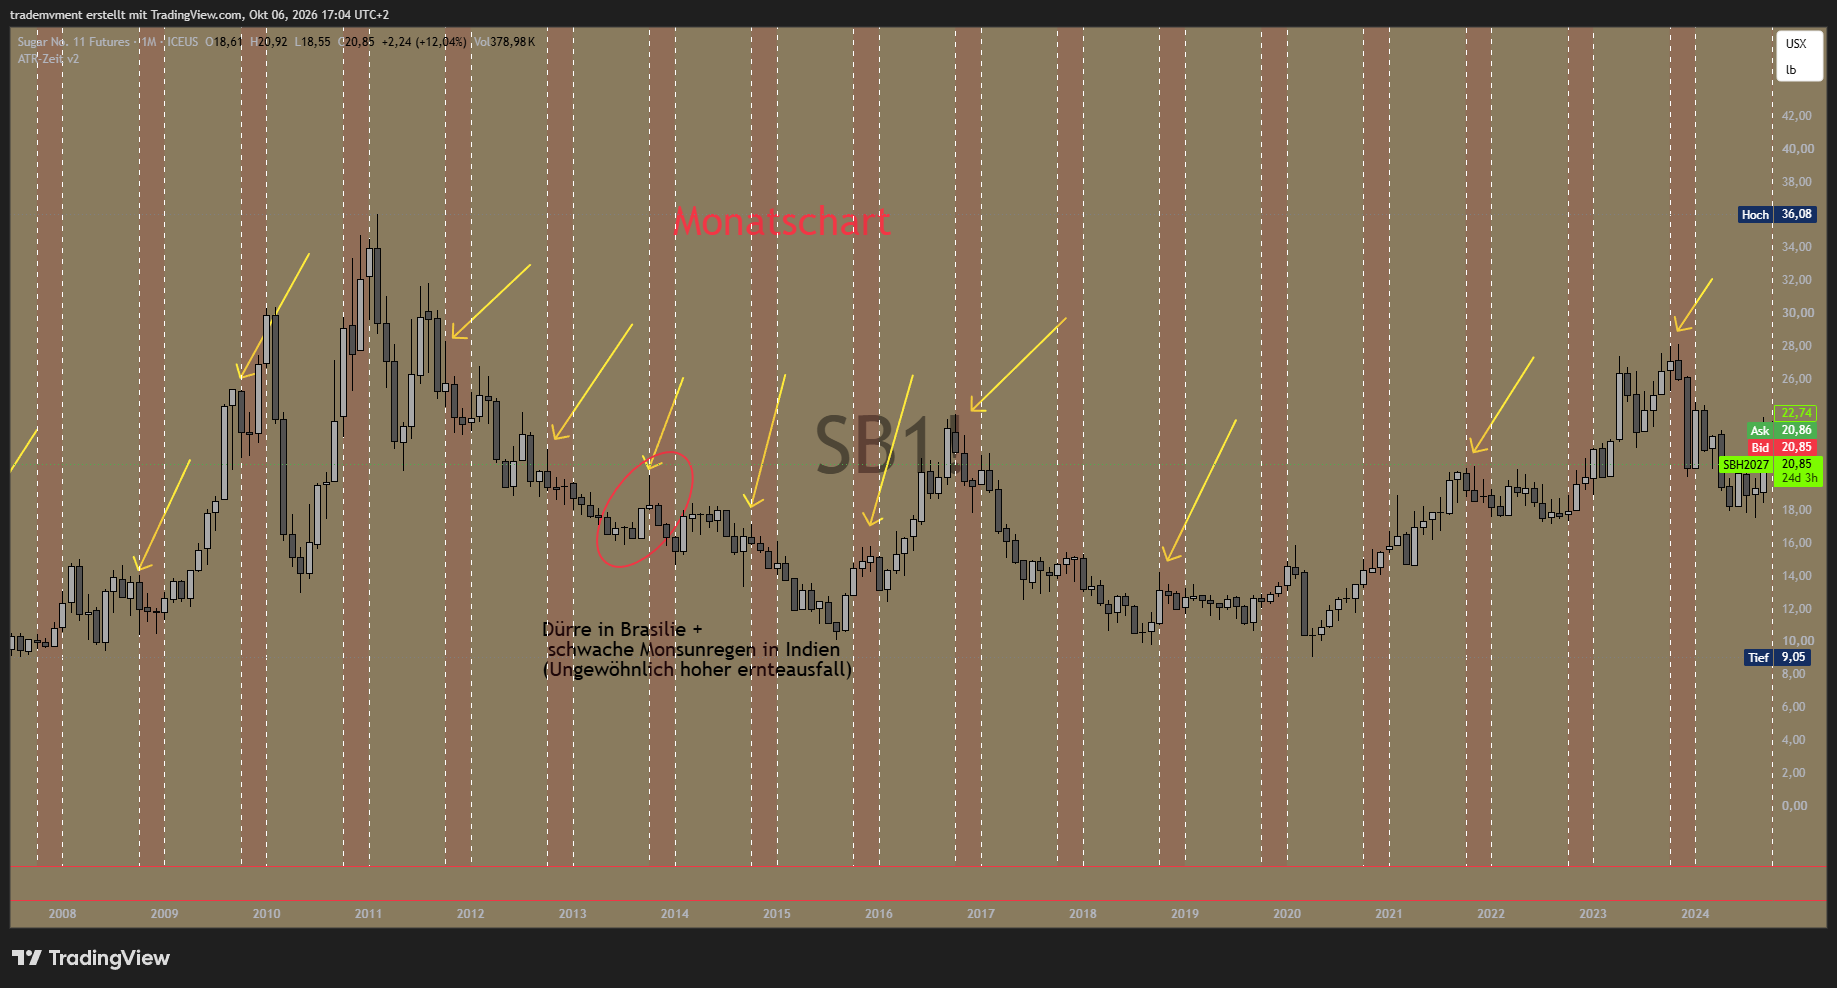
One striking example is the bearish reversal in October 2013.
In 2014, drought affected sugar cane growing in parts of Brazil, while India's monsoon was below average. Nevertheless, the linked chart shows significantly lower sugar prices by summer 2015.
For me, this comparison illustrates that weather problems and falling prices can coexist over a longer period.
4. COT: The shift in positioning
The Commitments of Traders report shows the open positions of different participant groups. In the Legacy data used here, I distinguish between:
Commercials: Reportable market participants with business-related hedging exposure to the respective commodity. These include producers, processors and dealers, among others.
Non-Commercials: Reportable participants without the corresponding Commercial classification, including many funds and large speculative market participants.
Non-Reportables: The residual positions calculated outside reportable holdings. This group is not a pure retail investor statistic.
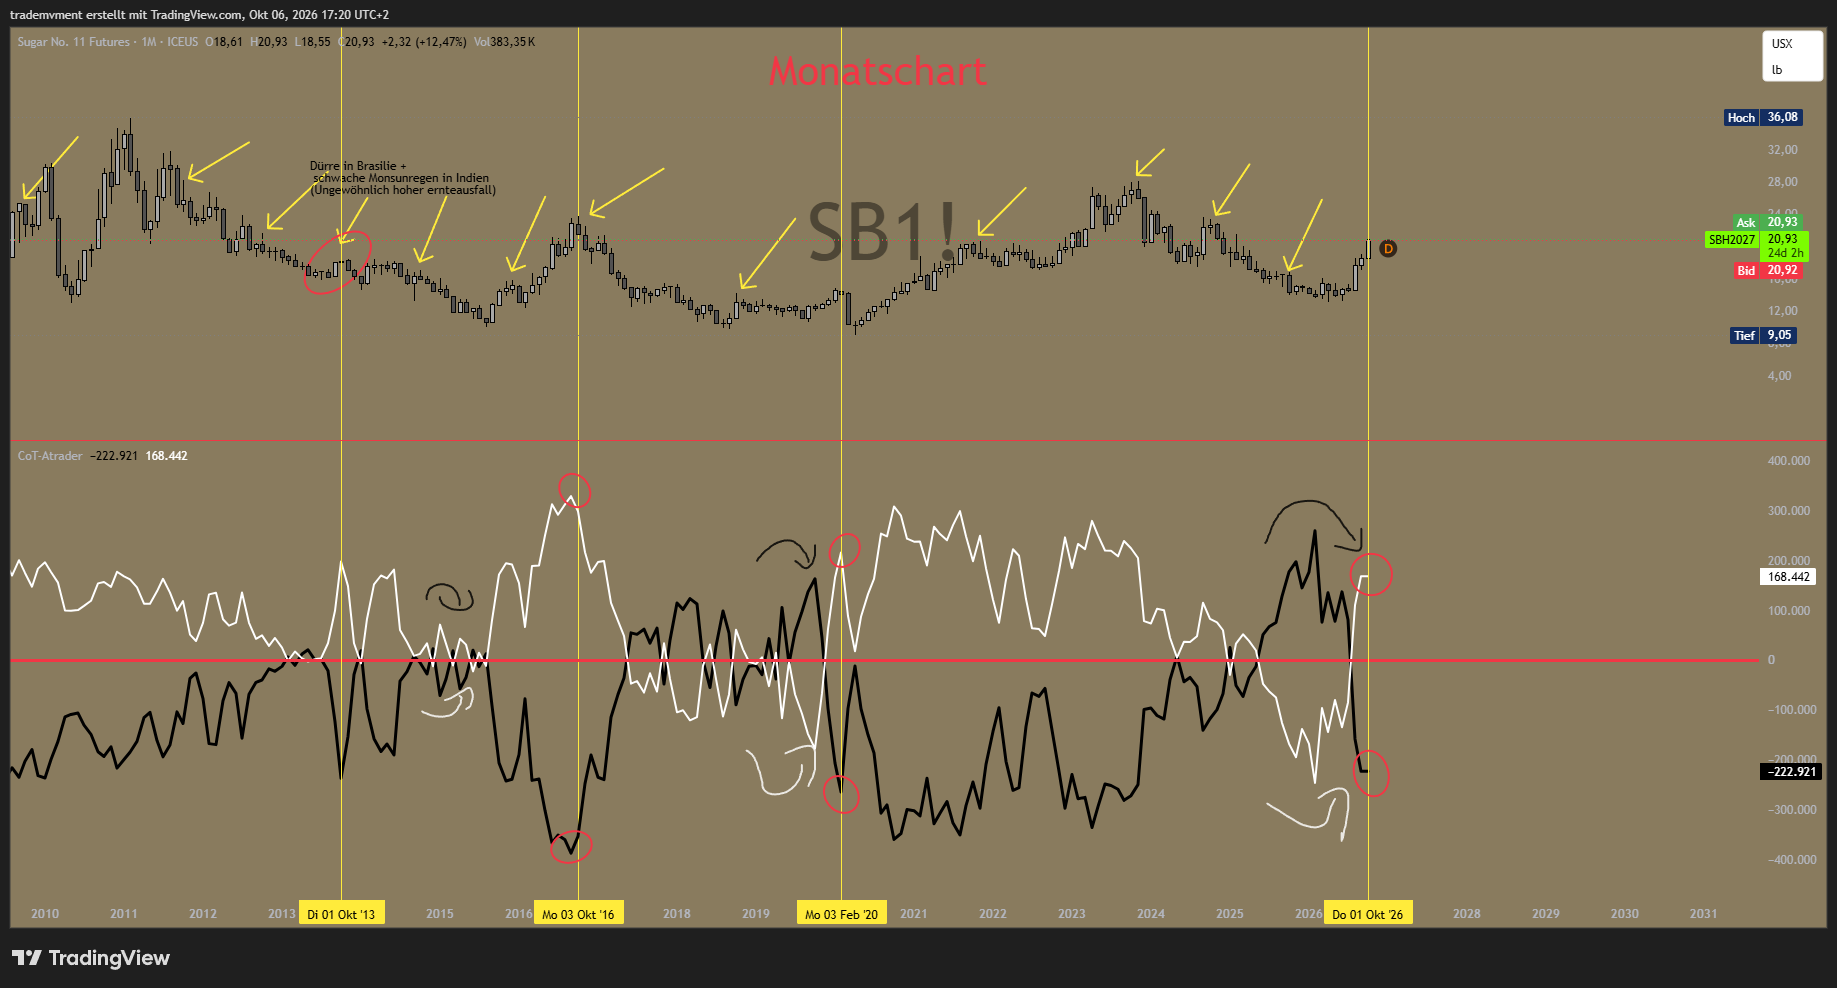
Net positions as of 29 September 2026:
Commercials: −222,921 contracts
Non-Commercials: +168,442 contracts
Non-Reportables: +54,479 contracts
In my comparison chart, white shows the net position of Non-Commercials and black that of Commercials.
The rapid shift stands out: Large speculators have moved significantly towards net long, while Commercials are more heavily net short again.
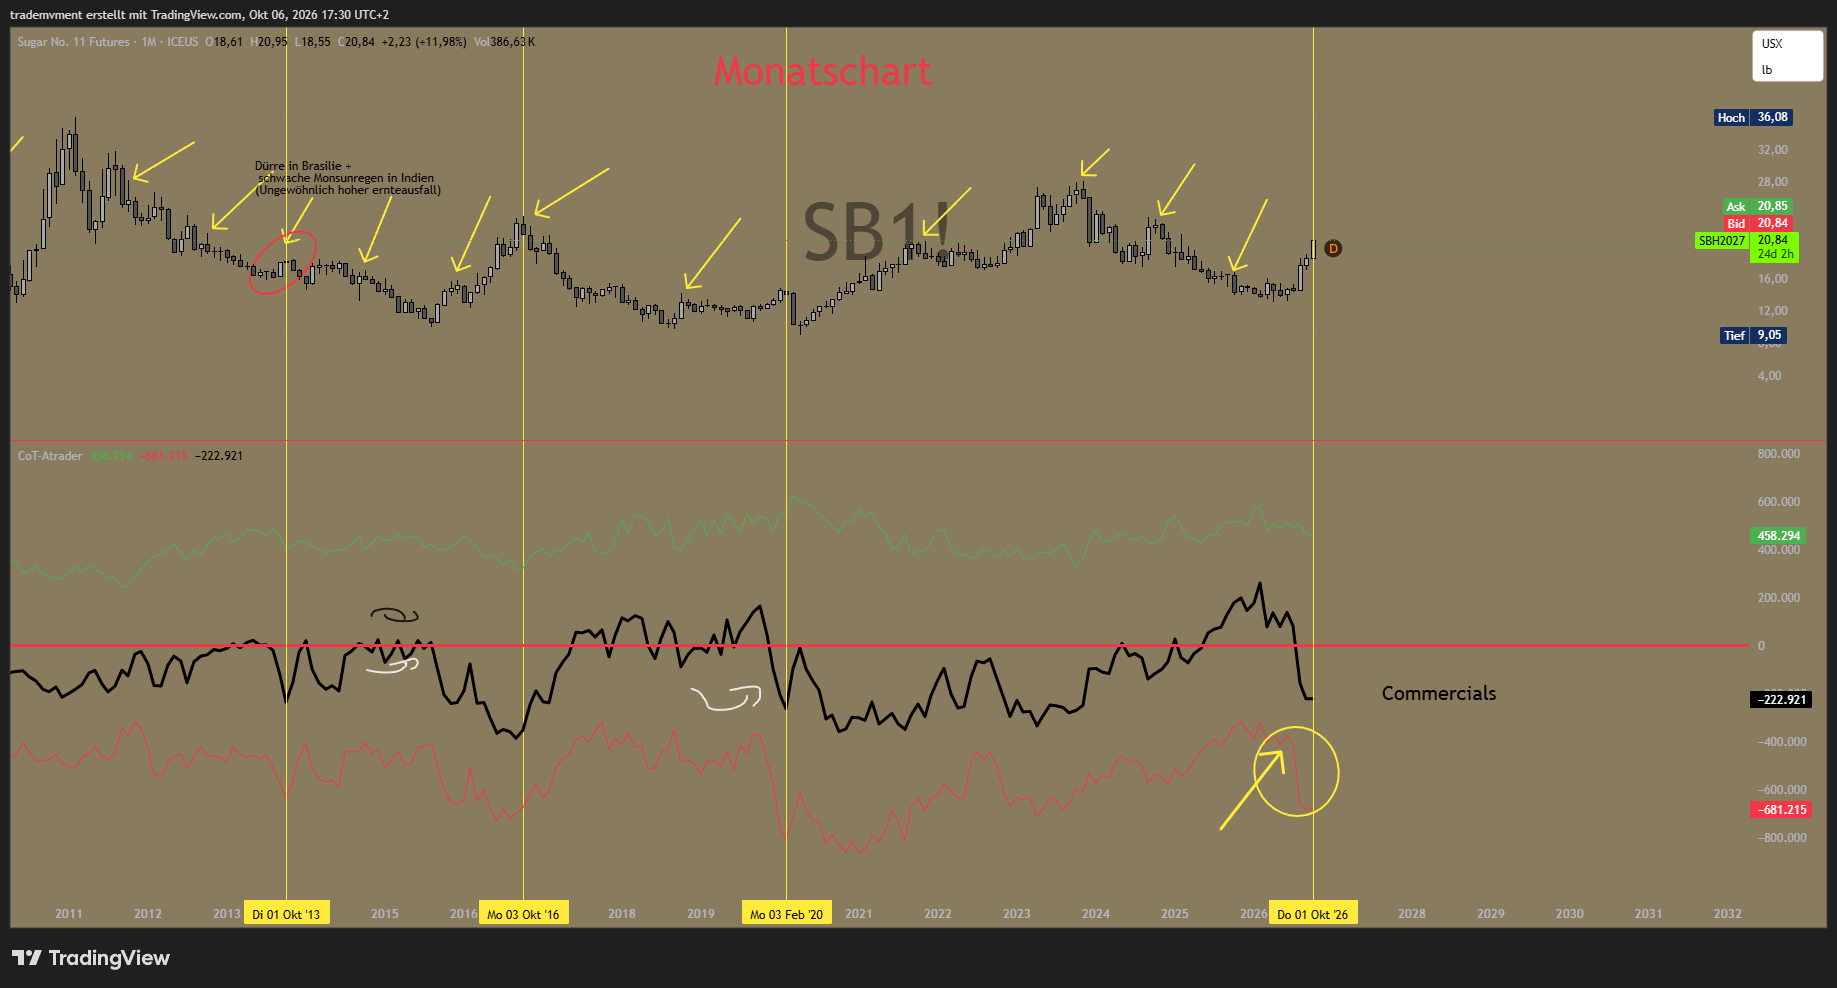
Commercials: Longs, shorts and net
During the larger positioning shift in the chart, Commercials substantially expanded their short holdings. In my display, shorts are plotted as negative: A falling red line means larger short holdings.
The latest weekly comparison is more nuanced, however. As of 29 September, Commercials reduced both longs and shorts. Their net position nevertheless became more negative because longs declined more sharply.
Commercial shorts may hedge future production or other business risks. Their size alone therefore does not yet confirm an imminent price decline.
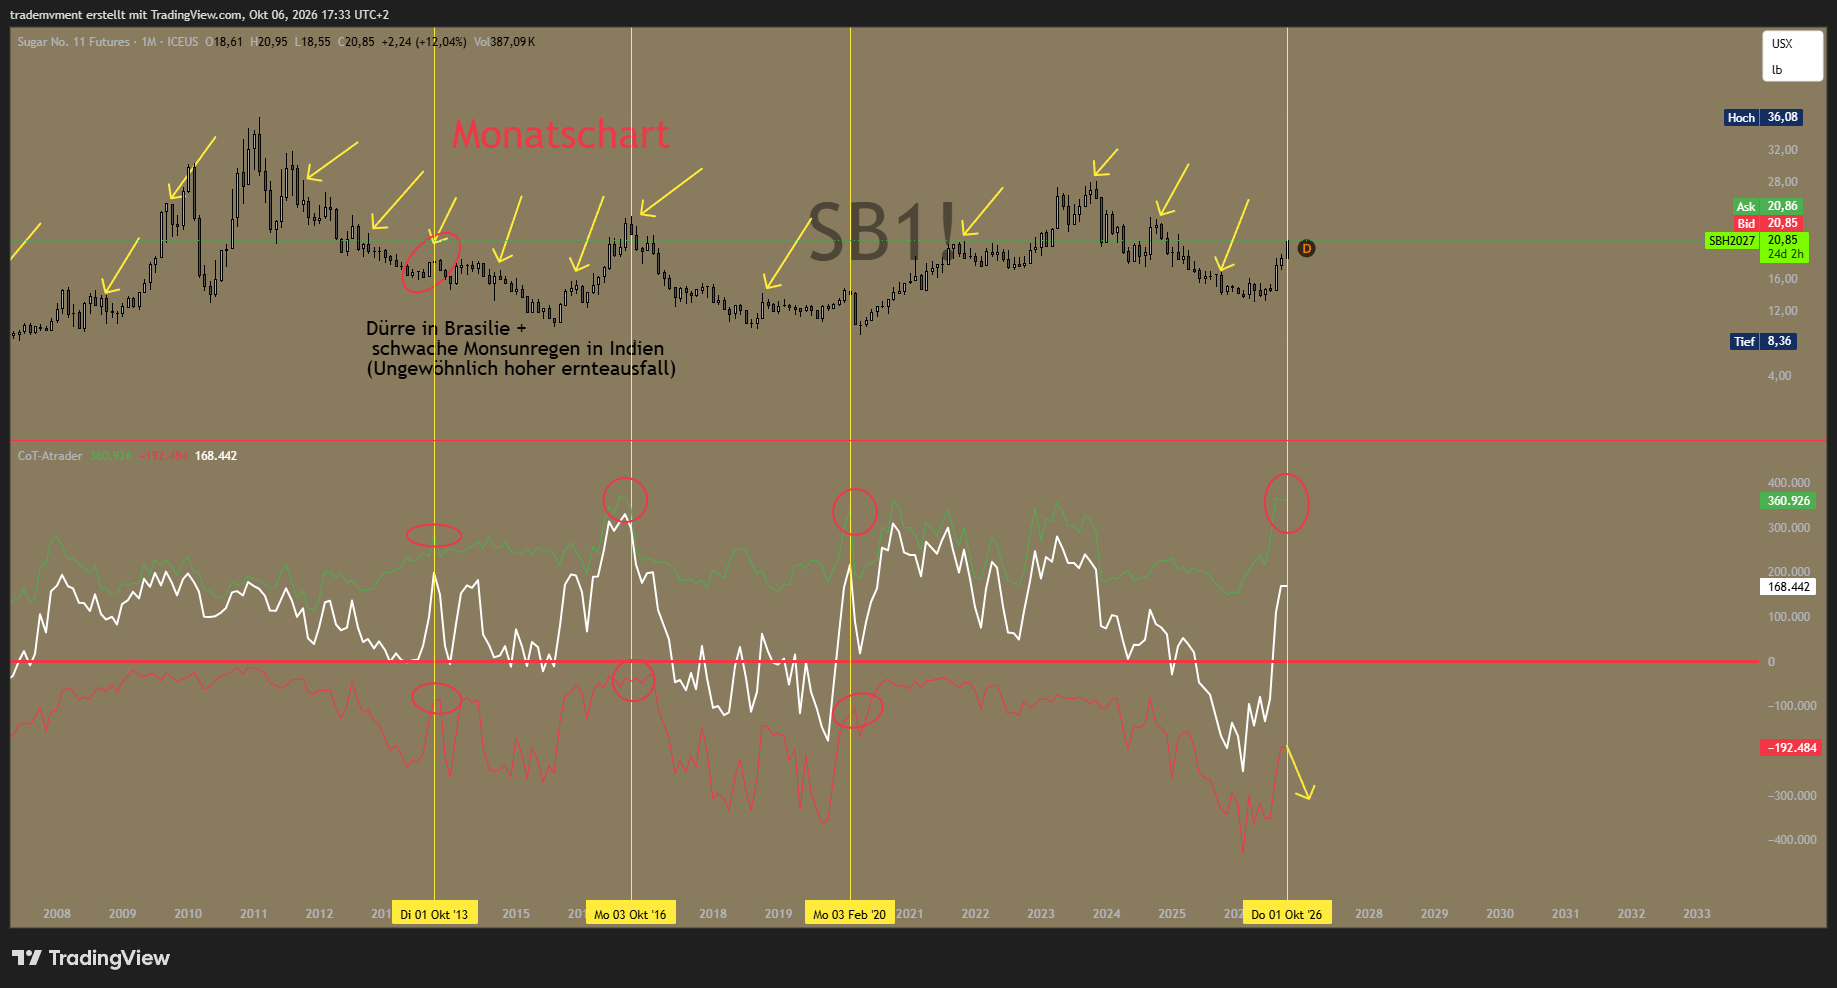
Large speculators: Building longs and covering shorts
Across the larger positioning shift, the chart shows more long positions and fewer shorts. This is consistent with a rally accompanied by both long accumulation and short covering.
In the latest reporting week, the net long position also increased despite a slight decline in long holdings: Shorts were reduced more sharply.
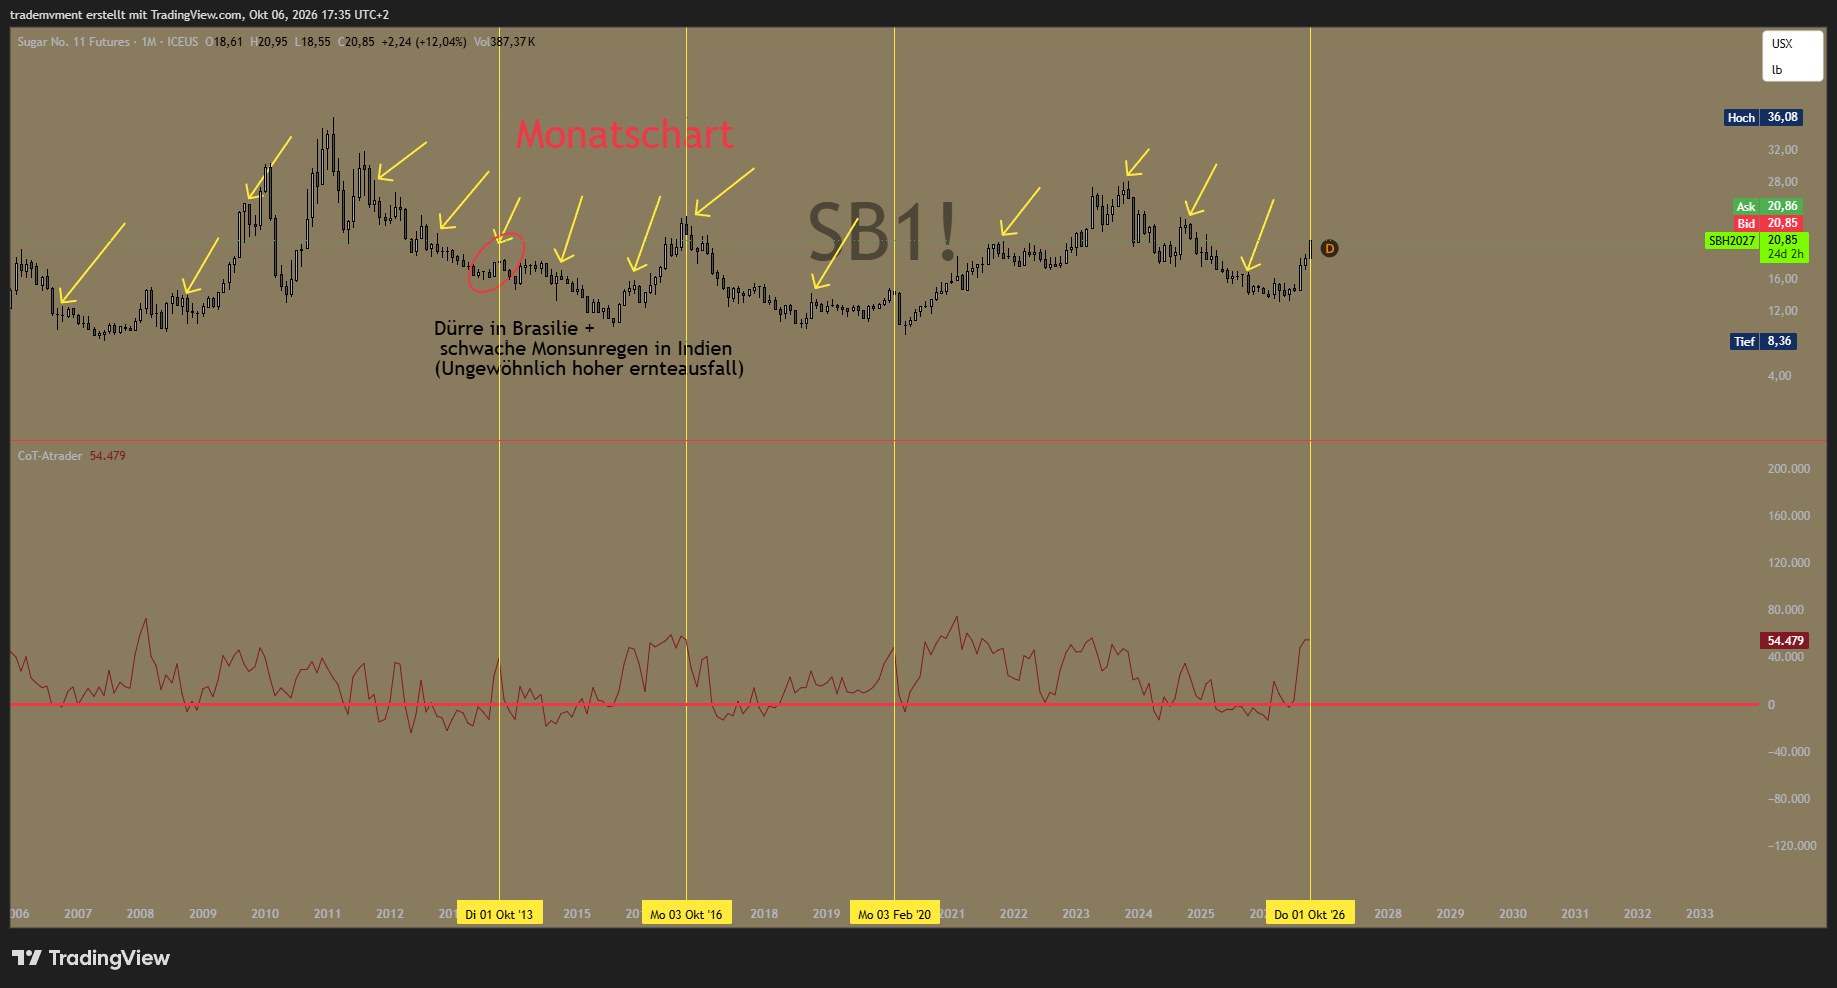
Non-Reportables: Clearly net long
The approximately 54,500 contracts net long are considerably elevated in the historical comparison shown.
My interpretation: Risk of long liquidation
If the rally loses momentum, profit-taking and reductions in long positions can create additional selling pressure. An accelerated liquidation forced by losses or margin pressure could produce a long squeeze.
That is my conclusion from the positioning picture.
5. Oil and sugar: The connection through Brazil
My broader oil thesis remains potential demand destruction: High energy prices and restrictive financing conditions can weigh on consumption and economic activity. Weaker activity can subsequently also depress energy demand.
I described this connection in my earlier oil analysis. That trade did not work out; I continue to assess the economic thesis against developments.
de.tradingview.com/chart/XTIUSD/yzdsfjln/
For sugar, the competition between sugar and ethanol production in Brazil is particularly relevant.
If weaker oil prices also make petrol and ethanol cheaper, and ethanol revenues fall relative to sugar, it can become more attractive for flexible processing facilities to process more sugar cane into sugar....
A higher sugar share could increase available supply and weigh on prices. How quickly and strongly that happens depends on the harvest, processing capacity, local fuel prices, exchange rates and policy requirements, among other things.
For me, this is a possible additional source of pressure. It does not imply a fixed one-to-one relationship between oil and sugar, and that is not relevant to me either.
6. Historical periods of weaker energy demand
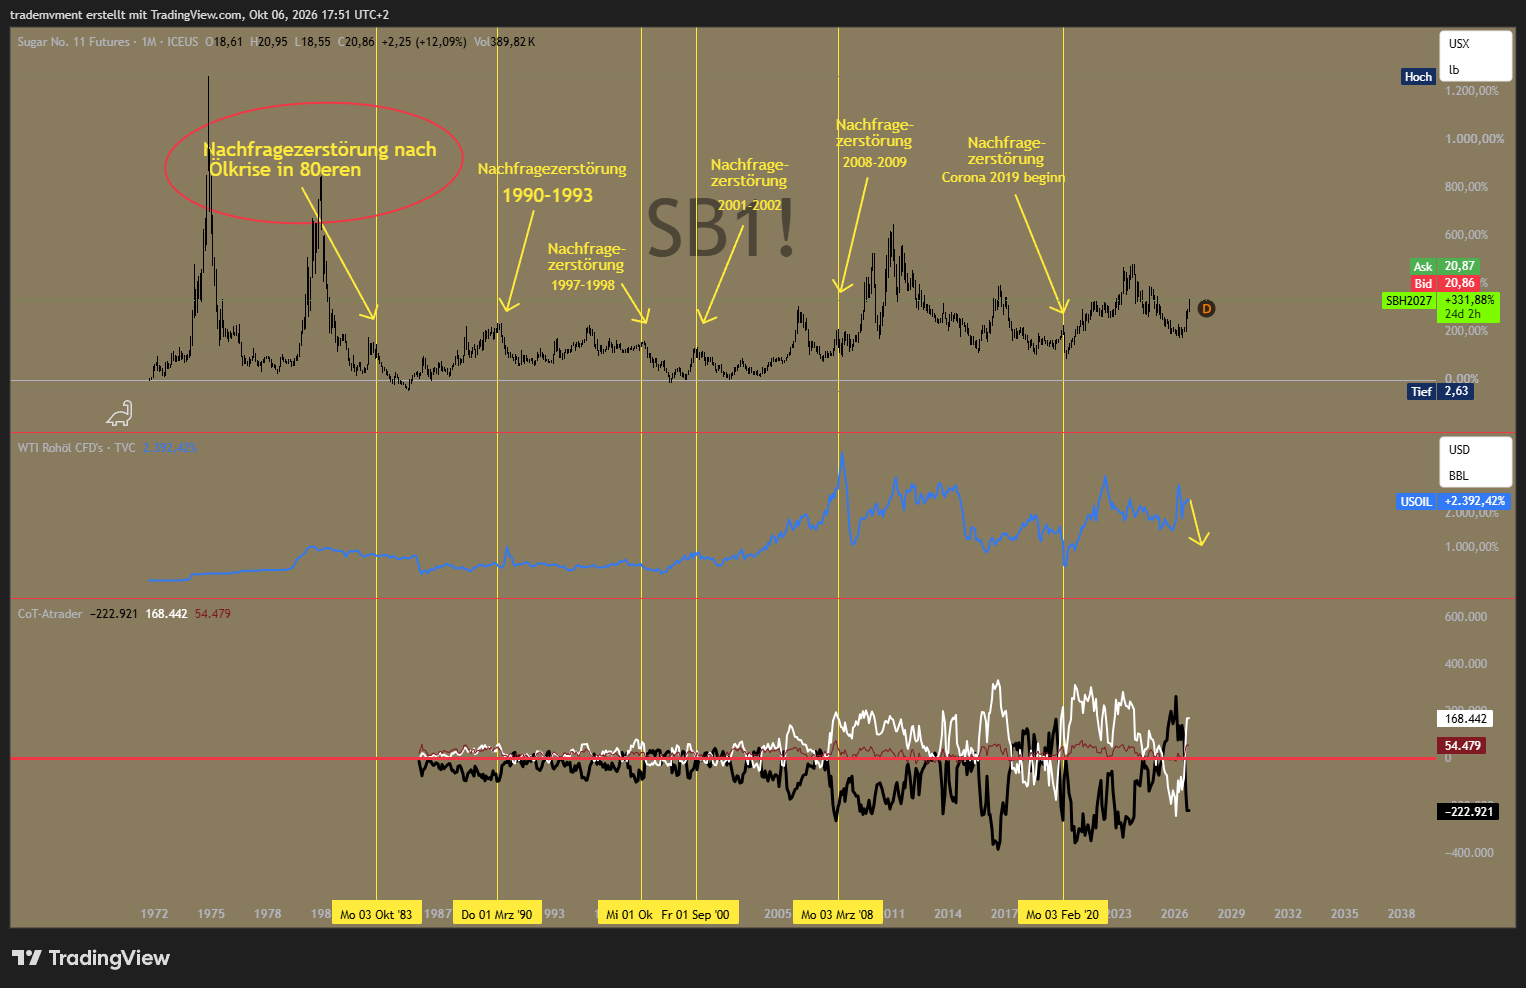
The following chart compares sugar, oil and COT positioning over a long period.
Relevant comparison periods include the recessions of the early 1980s and 2001, the 2008/09 financial crisis and the pandemic-driven demand collapse in 2020.
The causes and market conditions were different in each case. Today's connection through Brazil's ethanol market also cannot be transferred unchanged to every historical period.
I use these comparisons to examine recurring mechanisms. Visual co-movement alone does not prove causation.
7. The scenario I am following for the coming months
My bearish scenario is that the recent rally loses momentum and sugar corrects in the seasonal window through year-end. The start of long liquidation and weaker ethanol revenues could amplify this move.
Supporting evidence for the thesis would be:
A bearish reversal and a break in the recent upward structure.
A visible reduction in speculative long positions in subsequent COT reports.
Weaker ethanol revenues relative to sugar and a rising share of sugar in processing.
Evidence against the thesis would be:
A continued rally with breakouts holding and new highs.
Developments in oil and ethanol that make ethanol production more attractive again.
My bias remains bearish for 1–3 months. Price developments and the coming data must show how robust this window is.
Certain mechanisms recur. Their timing and impact need to be assessed afresh each time.
Source review · 17 October 2026
Links reviewed on 17 October 2026. Supplementary source figures were added during this review; the original publication date and TradingView charts are preserved.
Loading comments…