Gold: A Failed Recovery and a Tactical Short Below $4,145
Horizon: Tactical late-October to early-November 2026 scenario; conditional on price confirmation

Original analysis
21 October 2026 · XAUUSD · Bearish setup · Chart snapshots: 00:23–00:37, Europe/Berlin
Gold has already suffered a substantial decline, yet the recovery still looks weak. My focus is on the repeated rejection around $4,145 and whether sellers can use that area to push price back towards the recent lows. The short idea combines that price structure with a rebuilding speculative dollar position, persistent long exposure in gold futures and an inflation backdrop that could keep US monetary policy restrictive.
The daily snapshot shows gold near $4,130 after a high around $5,602, a decline of approximately 26%. A large fall can produce sharp rebounds. For this setup, the useful question is whether those rebounds can recover lost levels and hold them.
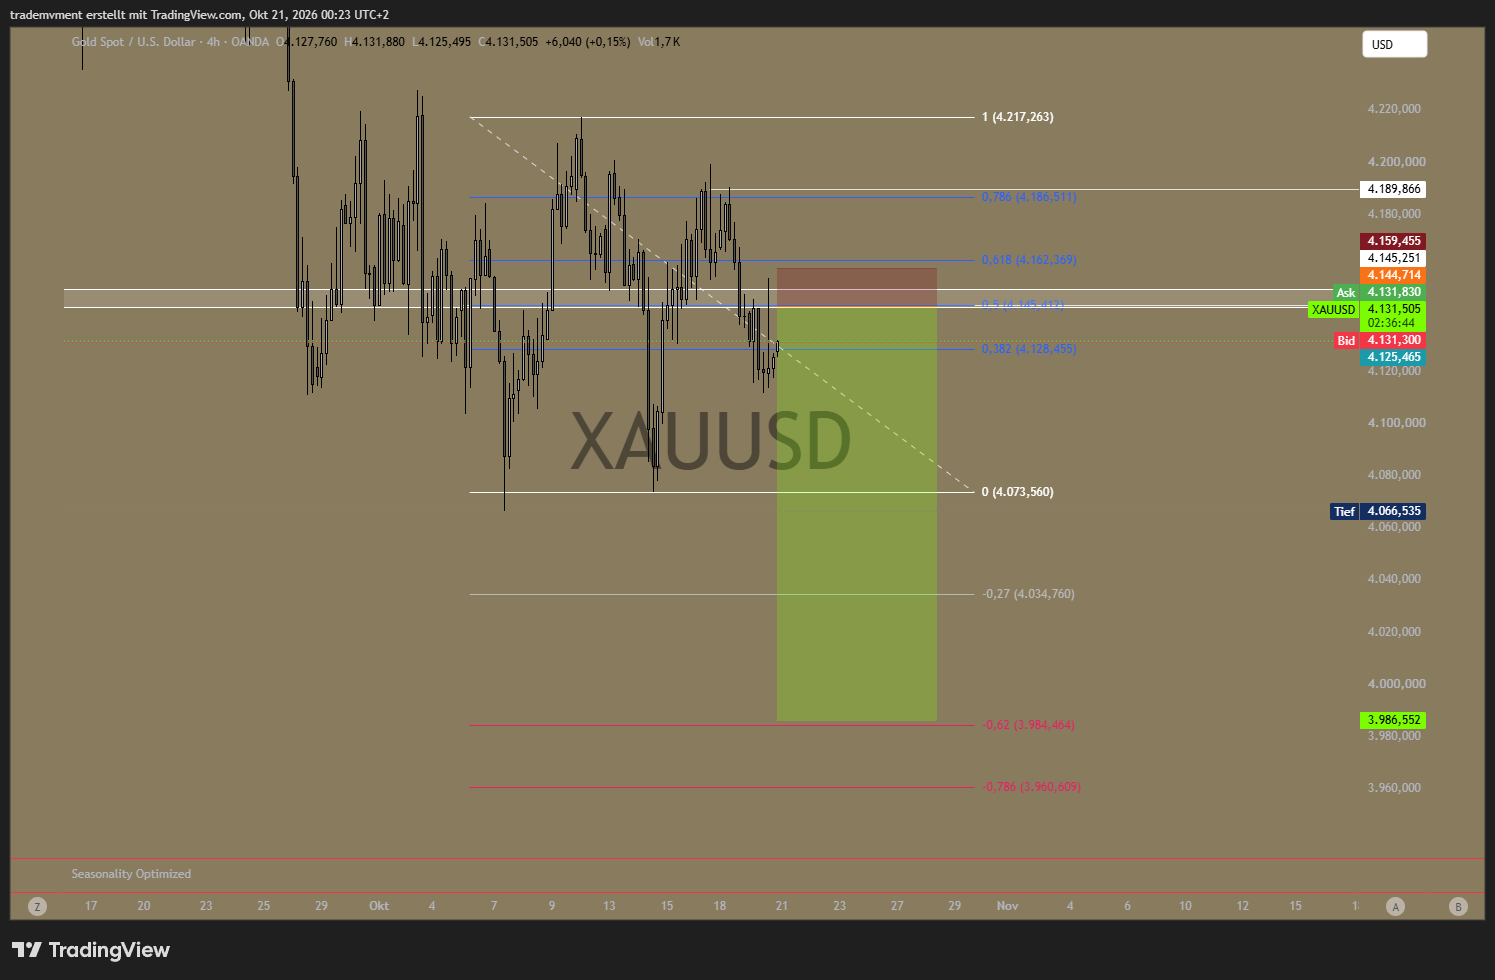
The four-hour chart shows successive attempts to recover within a damaged structure. Price has returned to the lower part of that range, and the area around $4,145 continues to matter. The marked midpoint at approximately $4,145.41 sits close to the horizontal resistance and the short reference in the drawing. I am looking for that area to remain a ceiling, followed by renewed pressure on support.
The dollar positioning comparison with 2021–2022
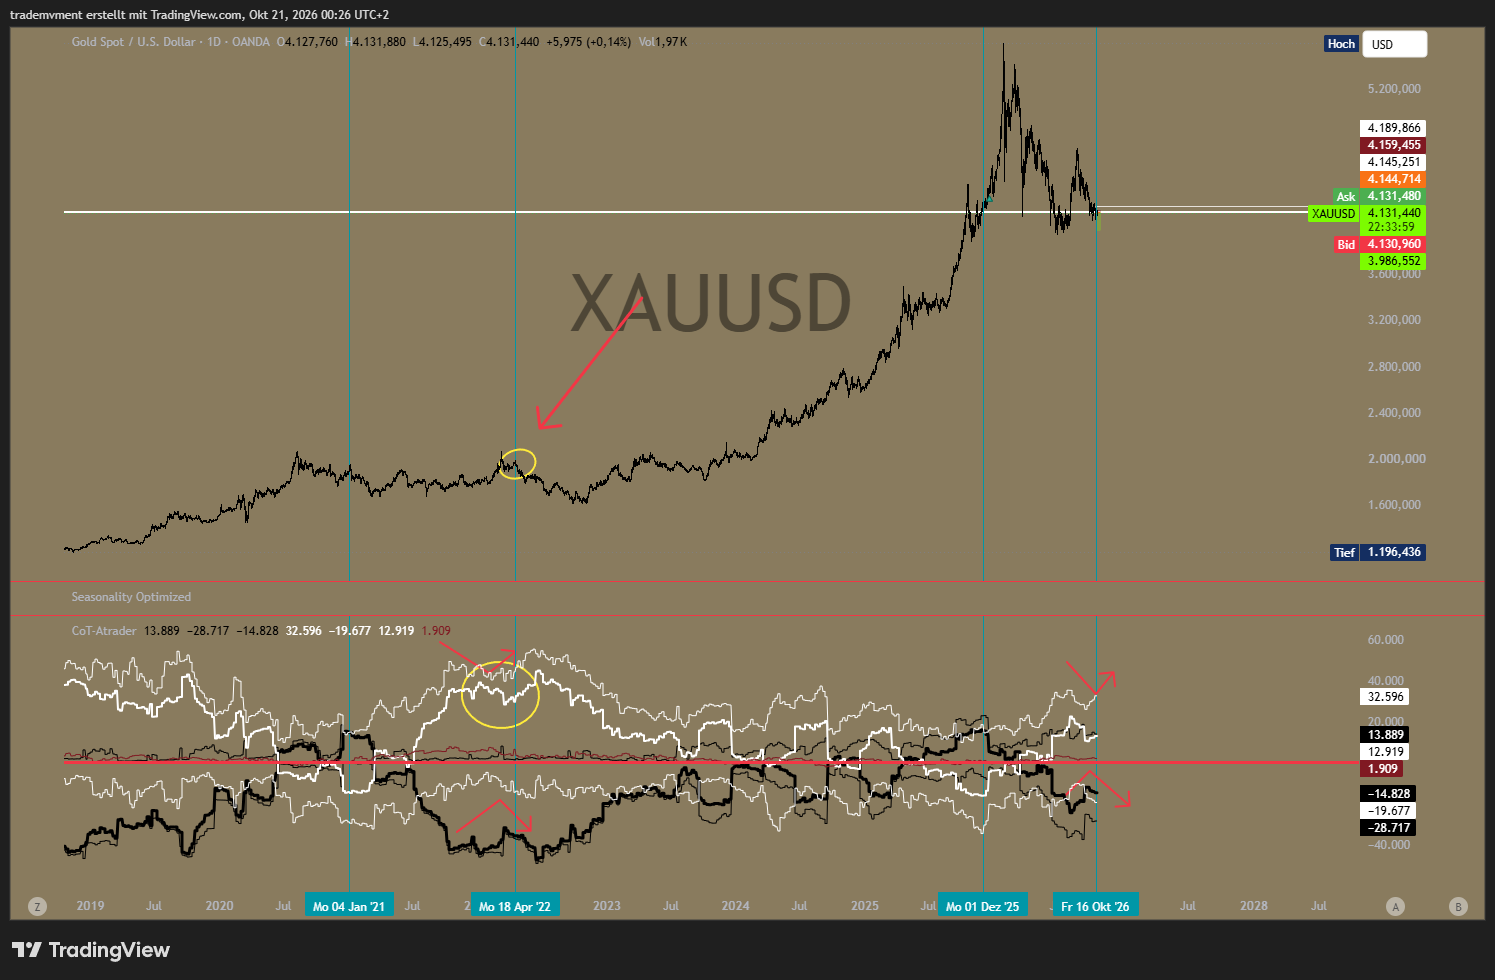
Historical positioning comparison.
The sequence highlighted in the chart resembles the 2021–2022 comparison: a prolonged reduction in non-commercial dollar exposure, followed by renewed rebuilding, with commercials moving in the opposite direction. I see that as a useful comparison for the pressure gold could face if the dollar strengthens again.
The COT overlay is a USD Index series displayed beneath the gold price. Its latest values match the ICE USD Index Legacy futures-only report for 13 October: non-commercials were net long 12,919 contracts, commercials net short 14,828, and non-reportables net long 1,909. Non-commercial net longs increased by 908 contracts from the previous week. CFTC USD Index report.
That gives the comparison a clear role in the setup. Renewed speculative demand for the dollar could become a headwind for dollar-denominated gold. The resemblance alone does not establish that the 2022 price path will repeat, and the opposing commercial position partly reflects how the futures market balances. I still need price to confirm the proposed dollar headwind through continued weakness in gold's recovery.
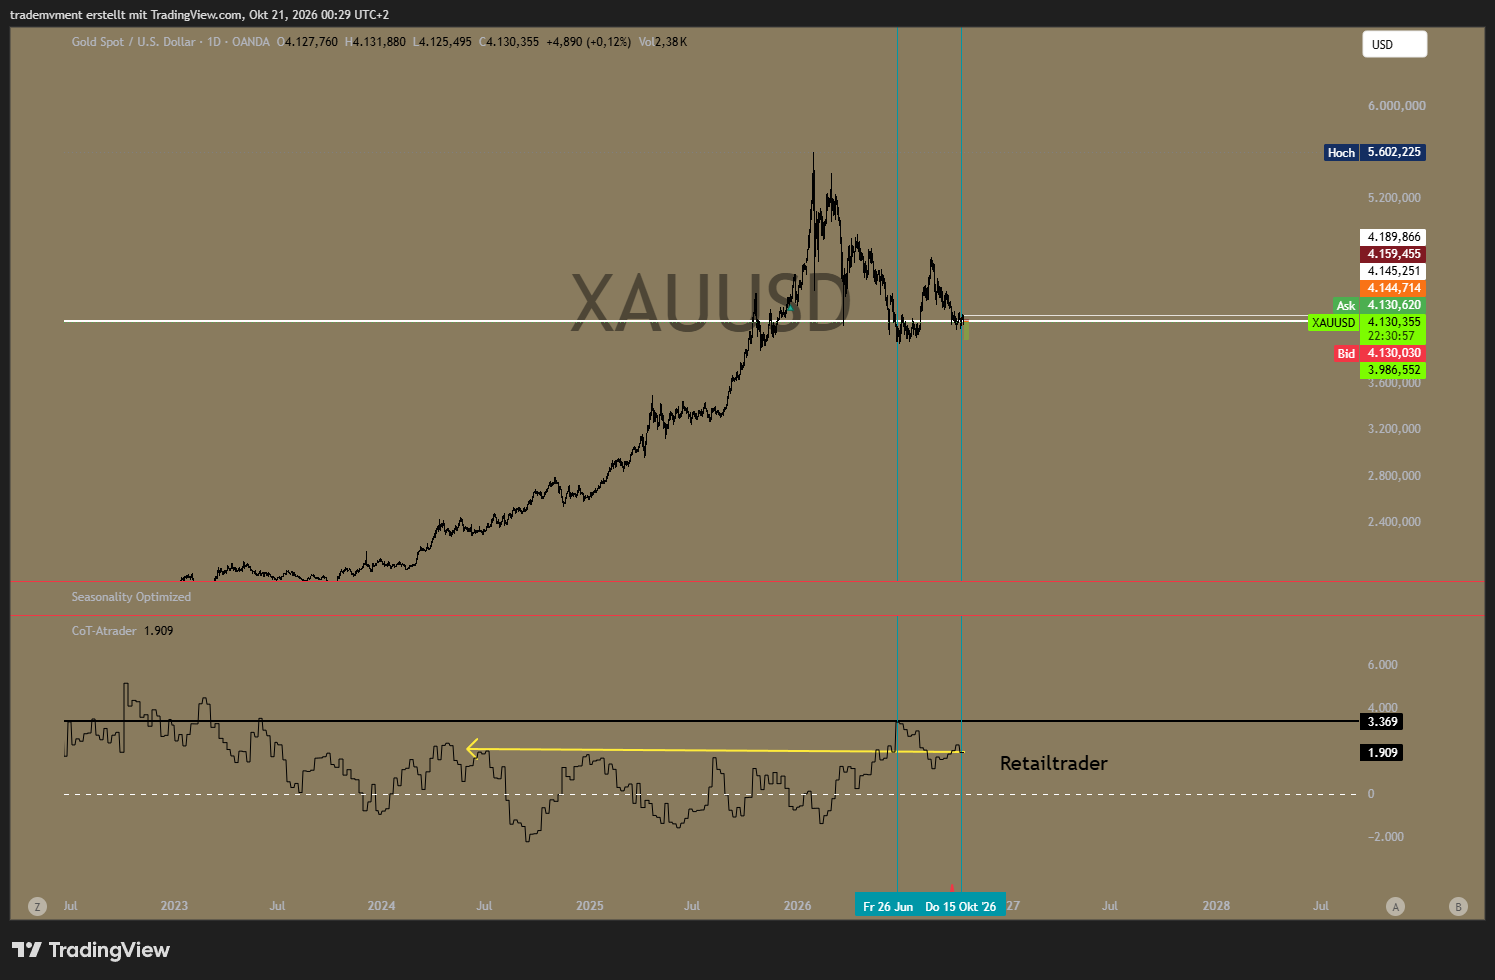
Smaller-participant comparison.
The line labelled “Retailtrader” in this snapshot also matches USD Index non-reportables. Its similarity to the marked May 2024 level therefore describes smaller-participant dollar positioning. It cannot establish how much gold retail accounts are holding. The latest dollar net long fell by 351 contracts, even as non-commercial dollar net longs increased. That divergence keeps the focus on how the groups respond from here.
Gold's own futures positioning remains long

The separate Gold dashboard row matches non-commercials: 245,300 long contracts against 37,421 short, leaving a net long of 207,879. Their long share fell from approximately 87.50% to 86.76%, a decline of 0.73 percentage points. This share is long divided by long plus short, excluding spreading positions. Net longs fell by 2,456 contracts. CFTC Gold report.
Gold non-reportables remained long as well: 50,731 longs against 16,079 shorts, or 75.93% long on the same directional-gross basis. Their net long increased by 460 contracts to 34,652. They did not reduce it in this report. Non-reportables are a residual futures category, rather than a complete survey of retail accounts or an official classification of trend traders. CFTC Gold report, category definitions.
For comparison, calculations from the preserved CFTC 2024 archive put Gold non-reportables' long share between approximately 65.5% and 67.8% across the four May 2024 reports. The current 75.9% is higher on that measure. The comparable net-position share of open interest is also higher. CFTC historical Legacy futures-only archives.
That persistence is the part I find vulnerable. Gold has weakened considerably, while speculative futures positioning remains heavily tilted towards further upside. If support breaks again, some of that remaining exposure could be reduced. Positioning supplies a possible source of pressure; the rejection and subsequent price behaviour supply the timing.
Seasonal windows provide context
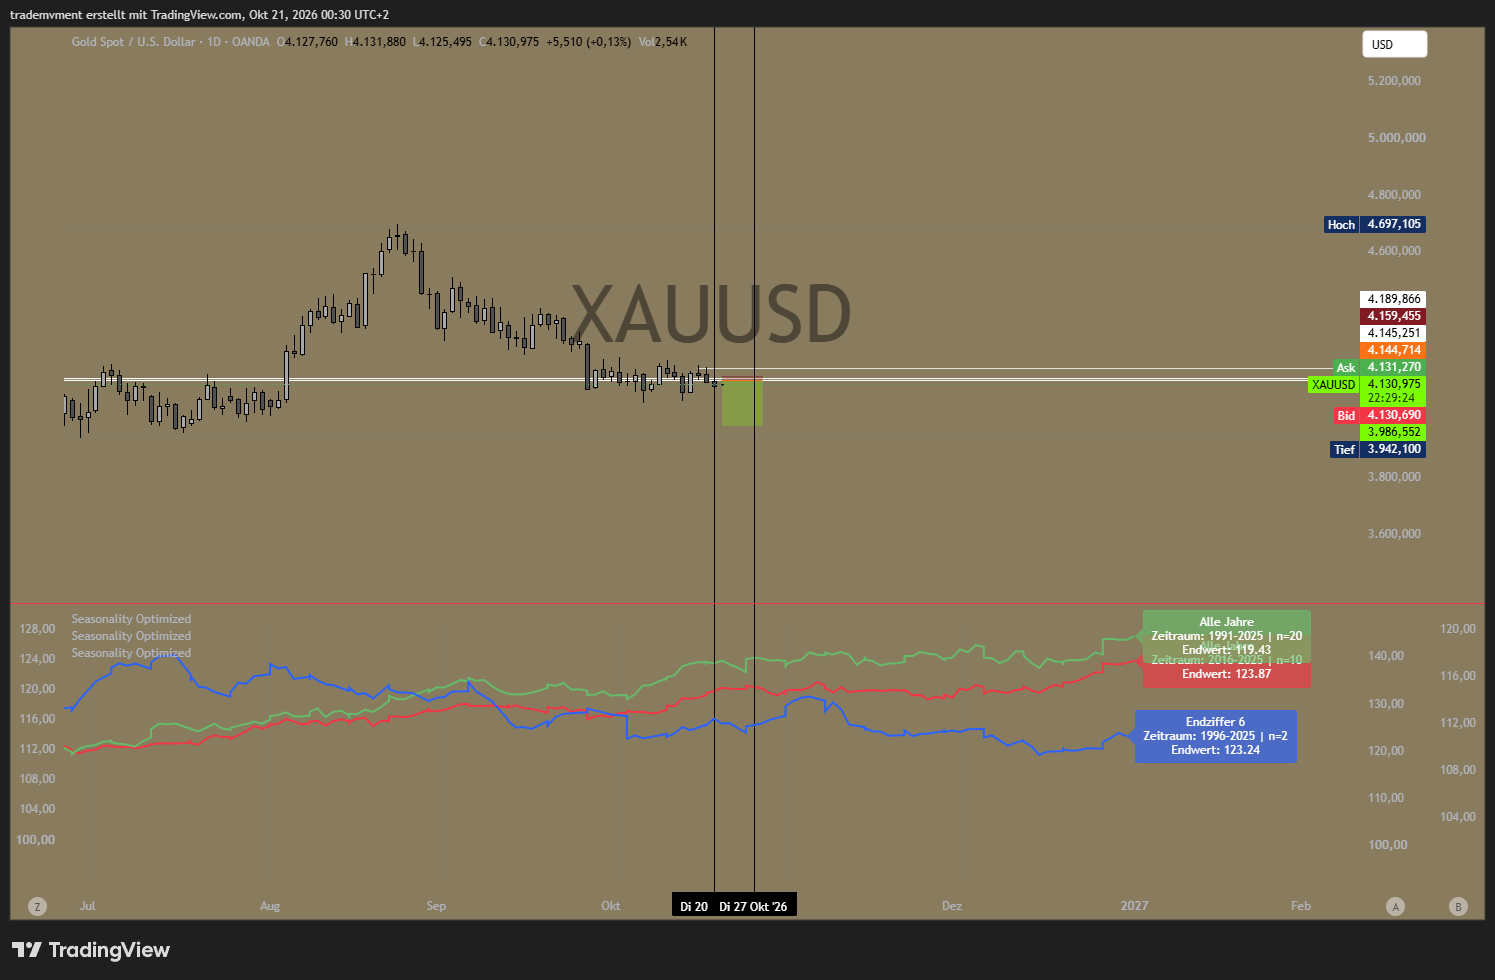
The seasonal charts draw my attention to the late-October and early-November window. In a market already struggling to recover, that is a period in which I am particularly interested in failed rallies and another move lower.
The paths are mixed. The end-digit-six line becomes weaker later in the displayed window, while the broader and recent-year paths are firmer in places. The indicator labels the end-digit-six sample n=2, so it deserves limited weight. I would not treat the three lines as independent confirmations of a short.
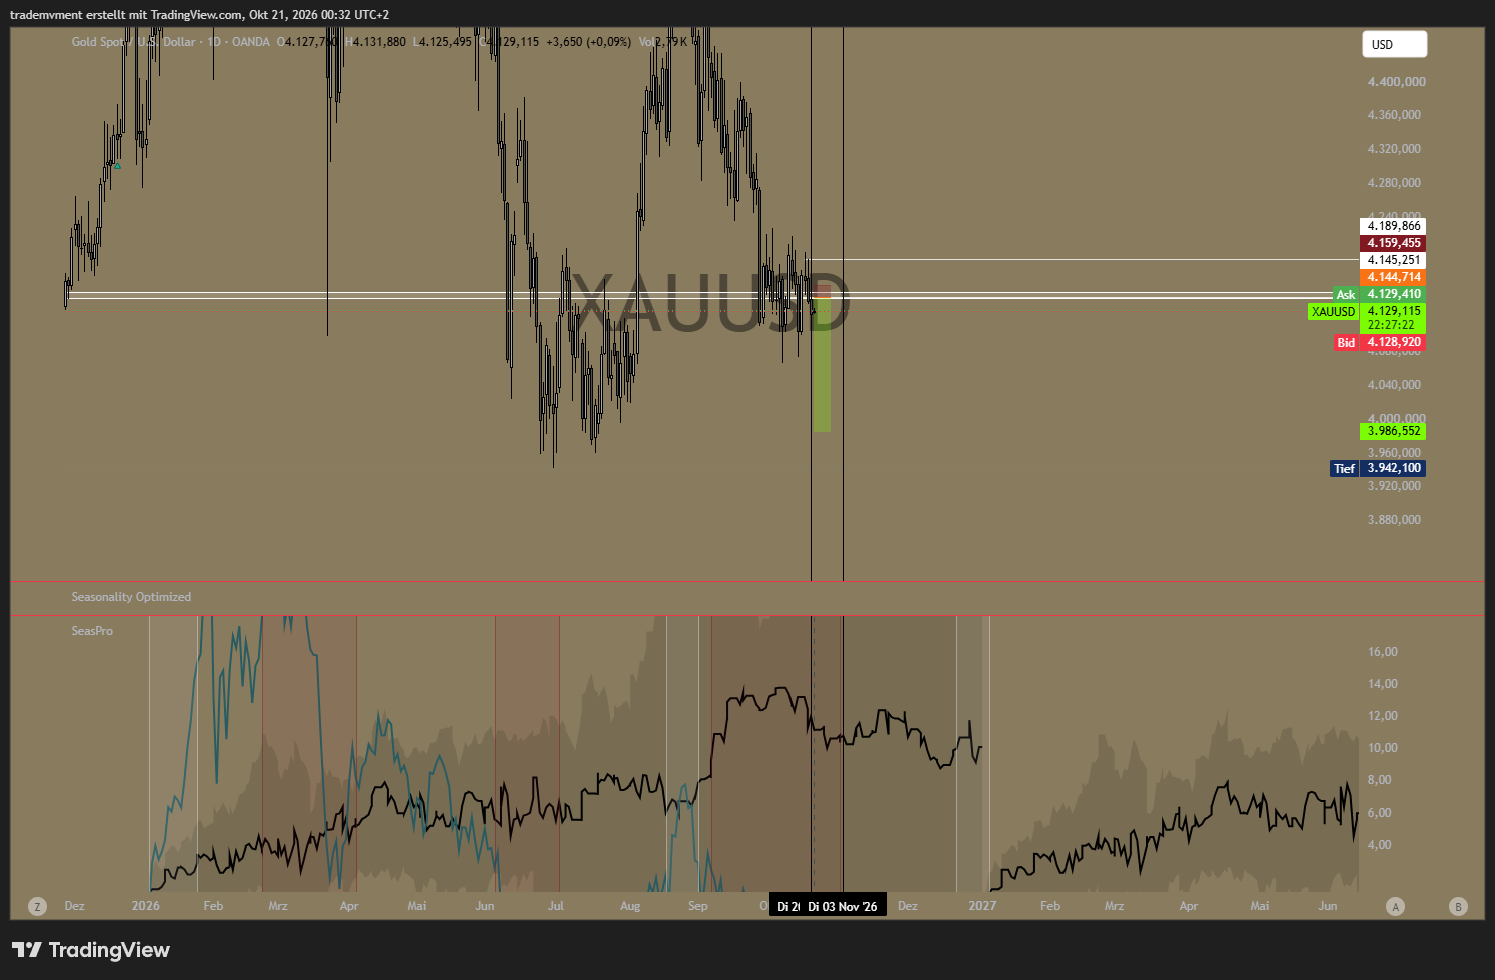
The second view provides another calendar perspective around the marked late-October to early-November period. Its role is to focus attention on the window. The trade still depends on the actual rejection, support behaviour and marked risk level; a seasonal path cannot override those conditions.
Rejection on the eight-hour chart and pressure in Asian hours
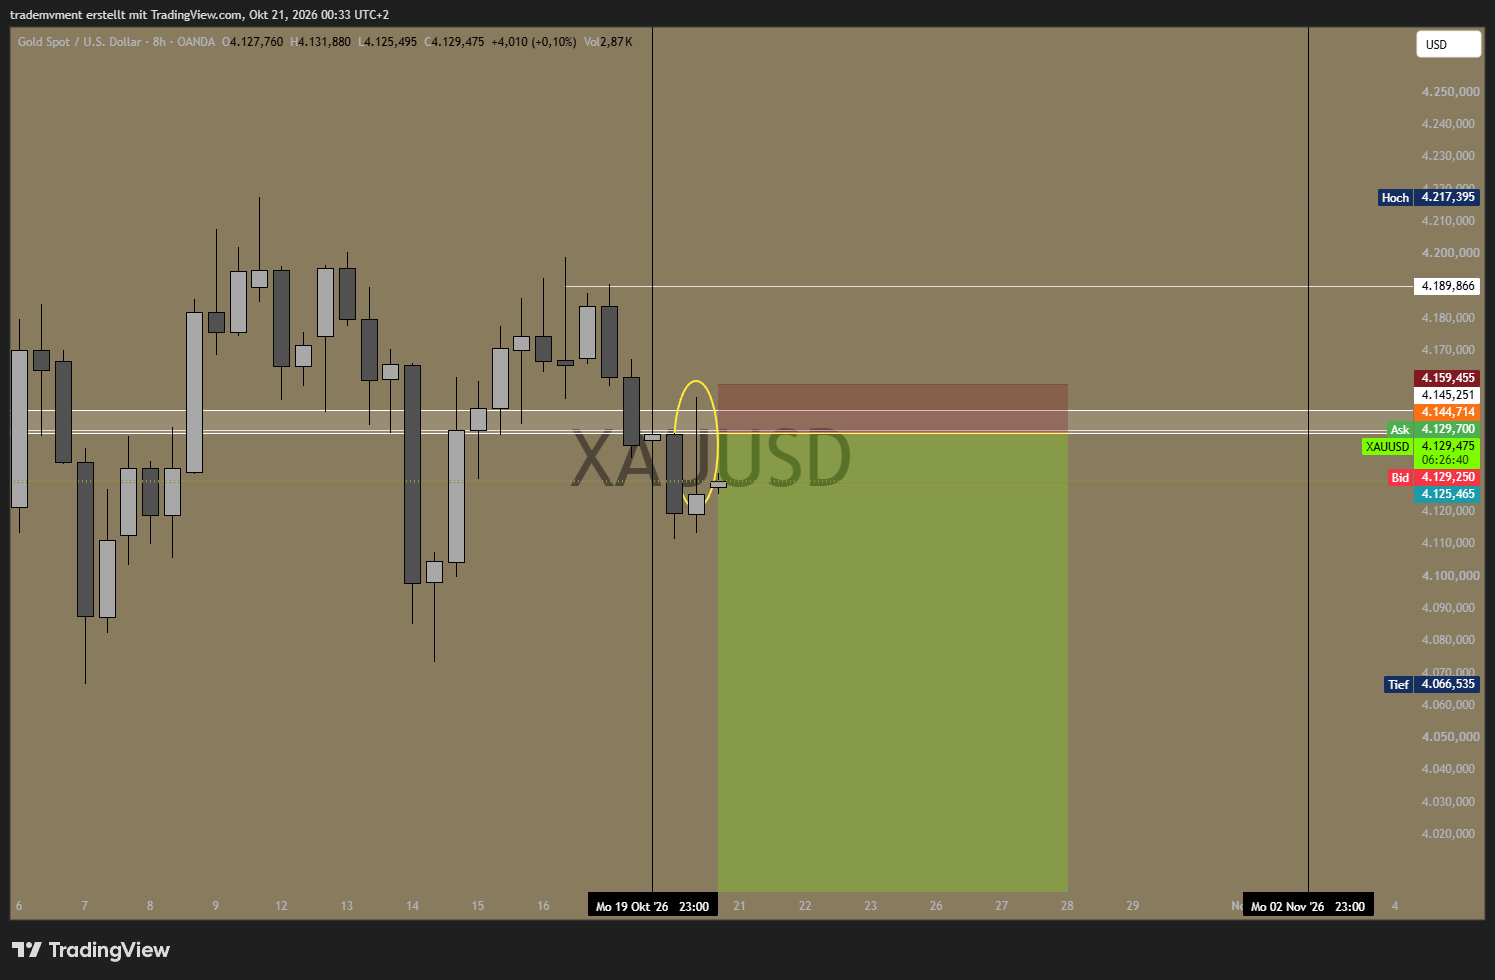
The circled eight-hour candle shows a push higher that failed to hold. Its upper wick and return towards the lower part of the range fit the selling pressure visible in the four-hour structure. Buyers have been able to test the area, but they have not established a sustained recovery through it. This is a reading of the candles; these spot-chart snapshots do not establish exchange-wide sell volume.
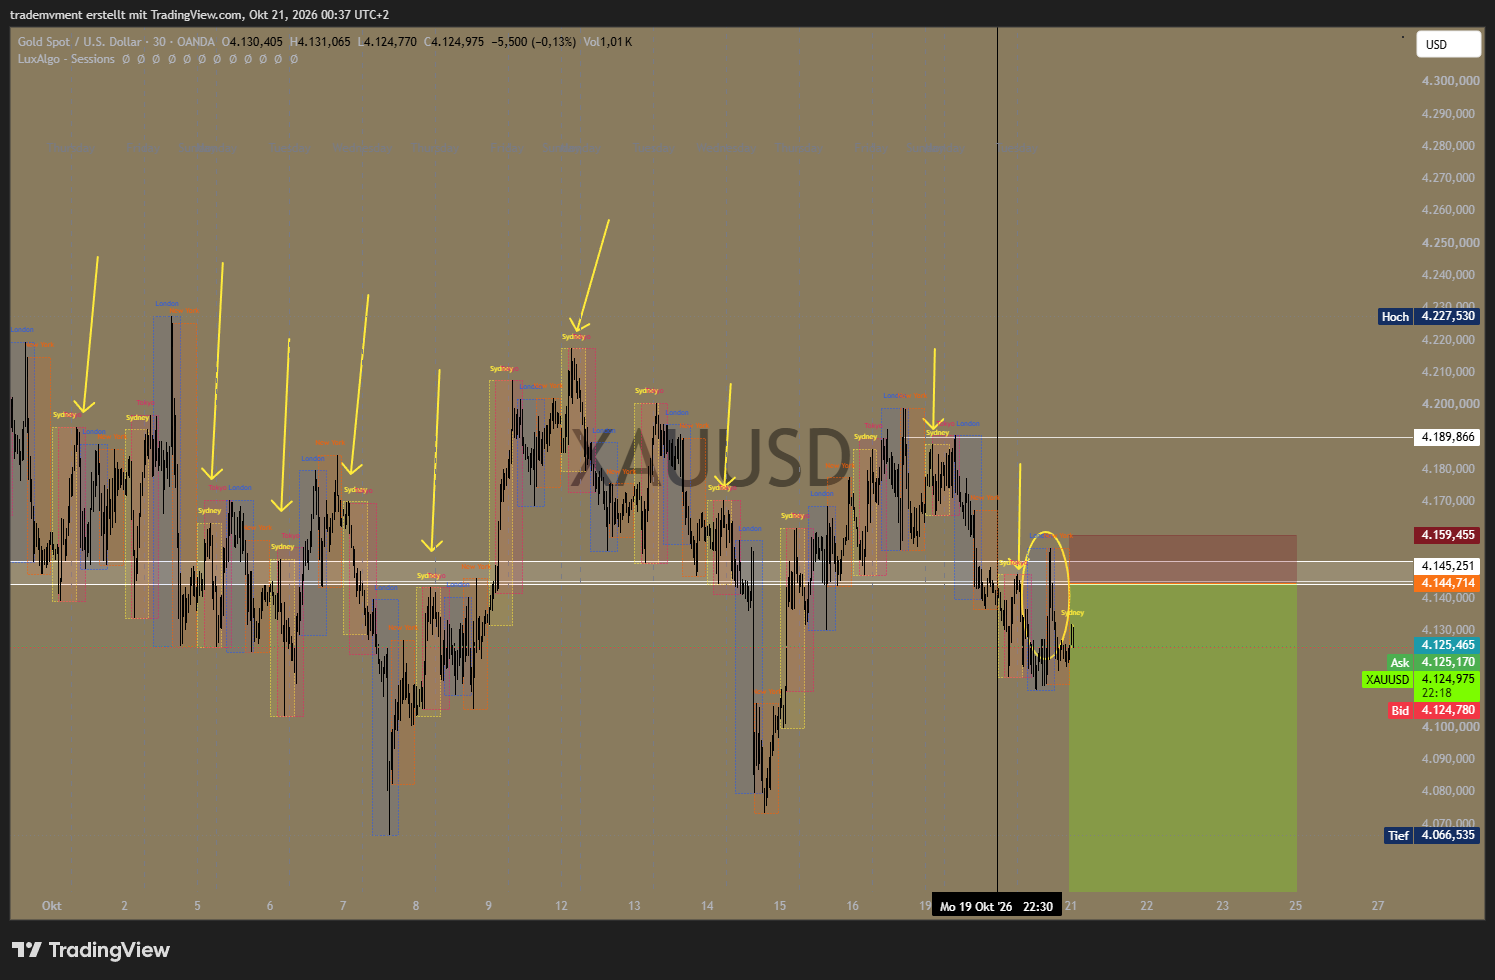
In my review of the last fourteen Asian-session windows, I flagged strong selling pressure in nine. The annotations cover Tokyo and the surrounding Asian hours, including Sydney. The repeated failure to hold early recoveries adds to my concern that rallies are attracting sellers. This is a recent visual sample, not a measured win rate for selling every Tokyo open.
Inflation leaves the Fed with an uncomfortable choice
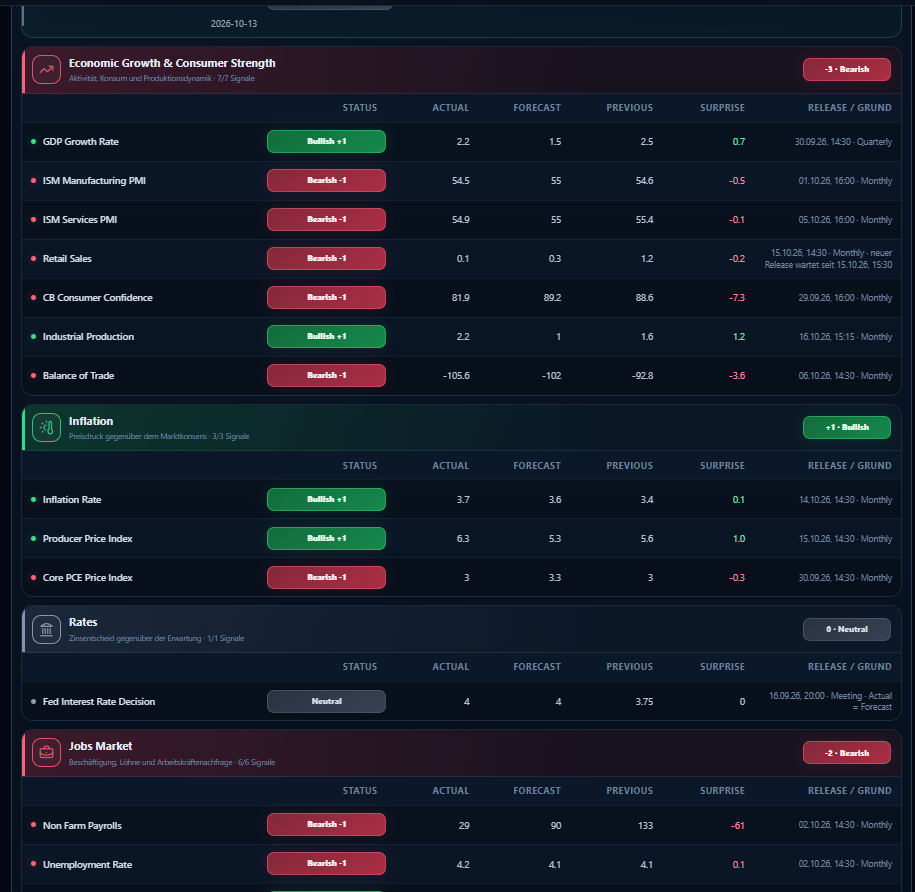
The macroeconomic tension is the same one discussed in my S&P 500 research: parts of activity and employment are weakening while inflation is becoming harder to ignore.
September payrolls rose by only 29,000, with unemployment at 4.2%. Headline CPI accelerated from 3.4% to 3.7% year on year, while final-demand PPI reached 6.3%. The dashboard also records several activity releases below its listed forecasts, although those consensus comparisons are separate from the official release figures. BLS employment report, CPI release, PPI release.
My concern is that inflation could keep the Fed on hold at restrictive rates or prompt another hike despite weaker growth. The September decision already raised the target range to 3.75–4.00%. Another hike remains my scenario, rather than an announced decision. Federal Reserve statement.
For gold, the bearish channel depends on the response of real yields and the dollar. If restrictive policy supports both, it could add pressure to an already weak chart. Inflation itself can also support gold, and weaker growth can bring demand for protection or lower expected rates. Those competing influences are why I require price confirmation. Chicago Fed research on gold's drivers.
The marked trade plan
The original drawing provides the following references, in US dollars per troy ounce:
| Reference | Marked level |
|---|---|
| Short reference | 4,144.714 |
| Stop reference | 4,159.455 |
| First support area | 4,073.560–4,066.535 |
| Downside extension | 4,034.760 |
| Main target | 3,986.552 |
At the exact marked entry, the distance to the stop is $14.741 and the distance to the main target $158.162, approximately 10.73 units of gross reward per unit of risk, before spread, slippage or financing. That arithmetic describes the drawing, not the probability of reaching its target. The snapshots already show price below the marked entry, so a later entry would have different risk and reward.
The bearish case needs the recovery to remain capped around $4,145 and selling pressure to return at support. A break through the $4,073–4,067 area would bring the lower extension and the main target into focus. If price recovers through the rejection area and reaches the marked stop, this particular setup has failed. The longer-term macro view does not cancel that trade-level invalidation.
My bias remains towards another leg lower while recoveries keep failing beneath resistance. The strongest evidence is the price response itself, supported by persistent gold longs and the possibility of renewed dollar strength. A sustained recovery, falling real yields or a weaker dollar would require that view to be reassessed.
Personal market commentary. Original charts and levels are preserved as supplied. COT figures are dated 13 October 2026; this article does not assert that an order was placed or a position was filled.
Scenario / targetMain chart target $3,986.552 per troy ounce. First support $4,073.560–4,066.535; intermediate extension $4,034.760. No executed position is asserted.
Invalidated ifThe marked stop is $4,159.455. A recovery through the $4,145 rejection area challenges the tactical short; the macro view does not override the marked stop.
Loading comments…