NGAS Long October–November + Long Q1 2027
Original analysis
English edition of the original analysis by trademvment. Original TradingView publication ↗
Natural Gas: Seasonality, a winter long and the larger cycle from 2027
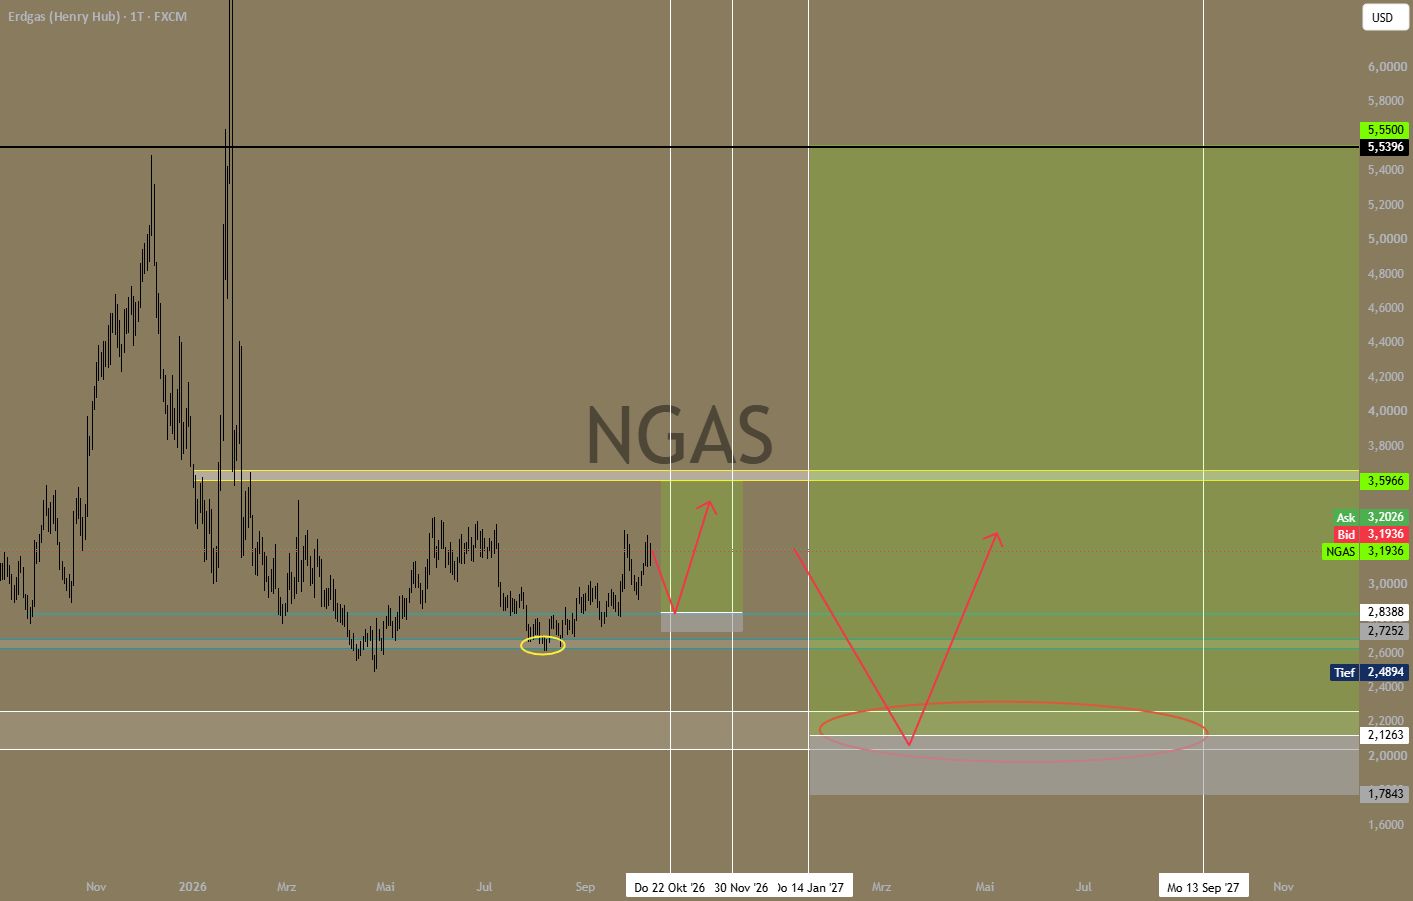
My gas idea consists of two phases: First, I want to trade the long side through November until the end of December 2026 at the latest. After that, I see the possibility of another sell-off, which could offer me a significantly lower entry in 2027 for a larger, long-term position.
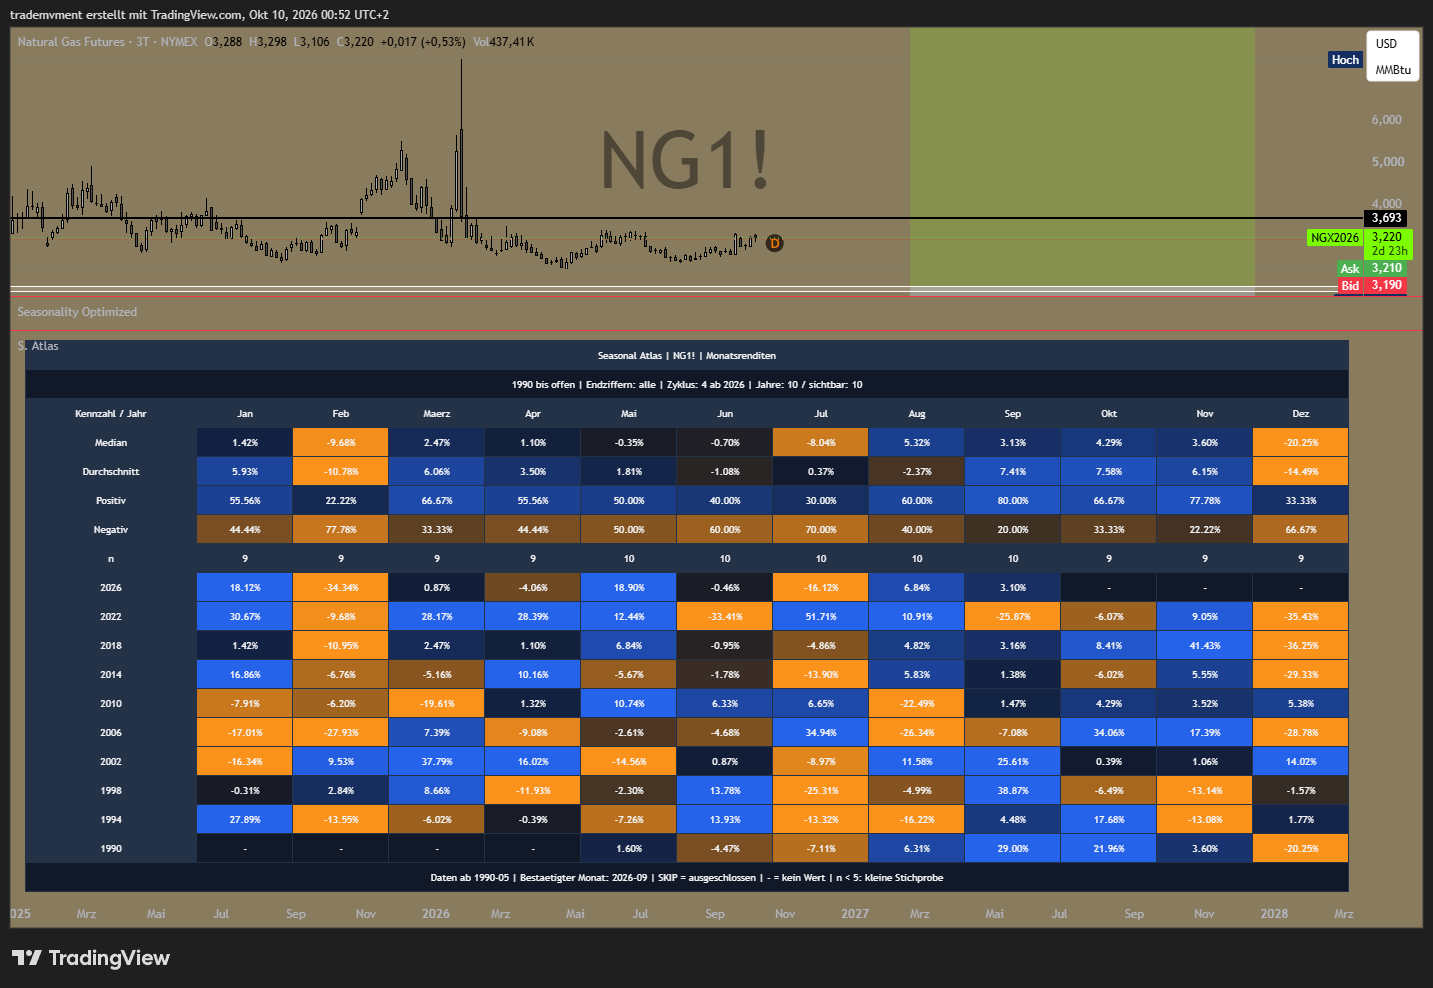
The price zones come from my FXCM NGAS chart for its history; the midterm seasonality is evaluated using the continuous NG1! future.
1. Seasonality: October and November in midterm years
Four-year cycle
October: 6 out of 9 months positive, corresponding to 66.67%. The median return is +4.29%.
November: 7 out of 9 months positive, corresponding to 77.78%. The median return is +3.60%.
December: 6 out of 9 months negative. The median return is −20.25%.
2. Short-term long: Potential for a winter peak
As the heating season approaches, weather-dependent gas demand usually increases. At the same time, the period of withdrawals from US gas storage begins. That is when I will enter.
The main chart shows a price around $3.19. The marked area around $2.73–2.84 is a possible pullback zone for me. On the upside, my initial reference is the yellow zone around $3.60.
Particularly during unexpected cold spells, this rise could be faster and more volatile. Initially, I see this as a limited winter trade. I may only prepare the larger entry after another pullback.
3. Entry window in 2027
For the larger long, I am interested in $2.00–2.13.
In the following chart, I have compared the recurring winter periods, the swings in storage data and my planned entry window between January and March 2027.
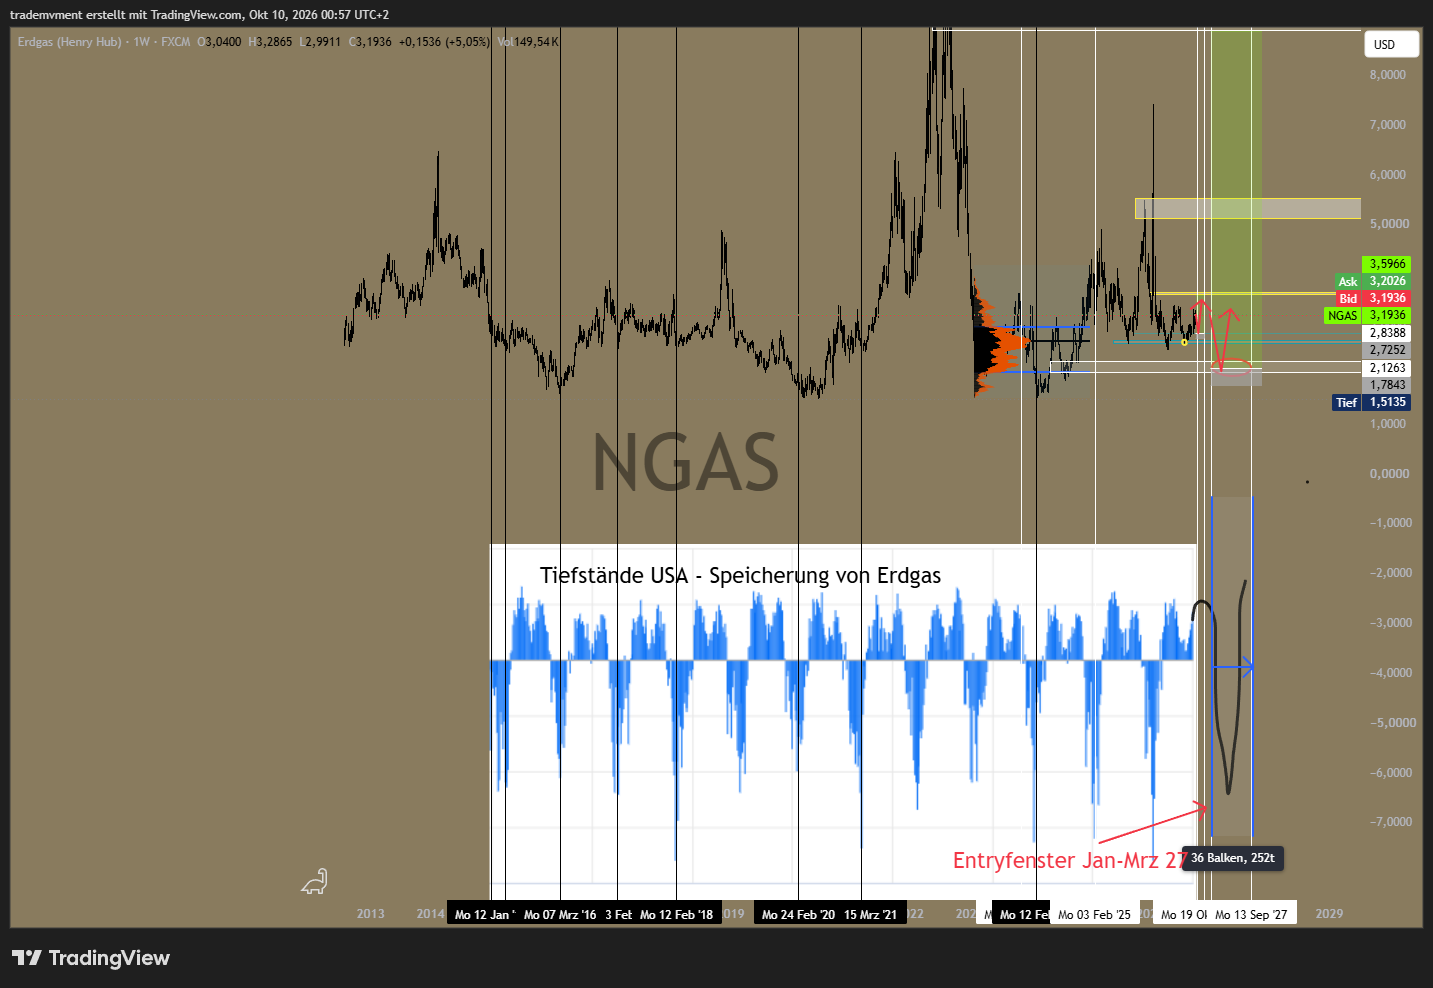
I only check the absolute storage level. The seasonal minimum in total storage volume is often not reached until late March.
That is where you should check the five-year average and see whether an actual shortage is developing.
4. Extreme cold: Demand rises while supply can be disrupted
Extreme cold can hit gas twice at the same time.
So... households and power generators need more energy, while production outages can hit the supply side hard. That is why gas tends to be extremely volatile. (War and similar events naturally play a role too, but that is another topic.)
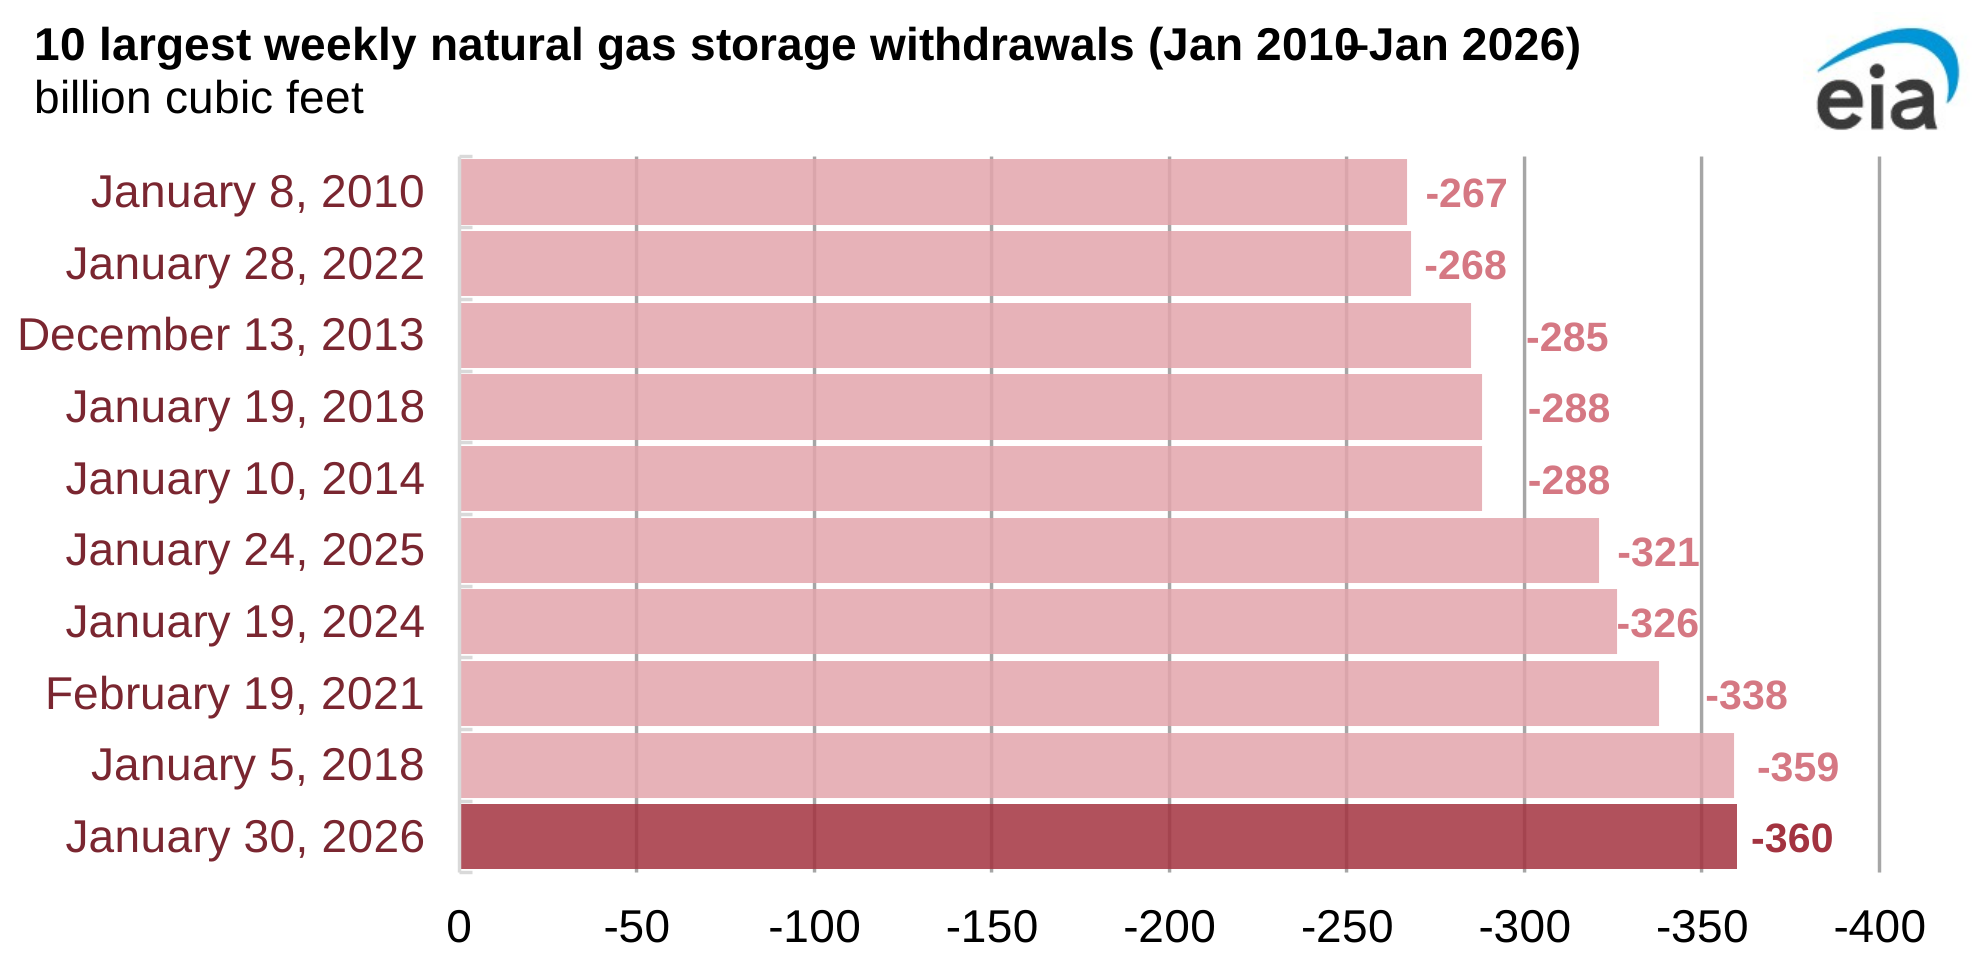
One example is January 2026: The EIA reported a record withdrawal of 360 billion cubic feet for 30 January.
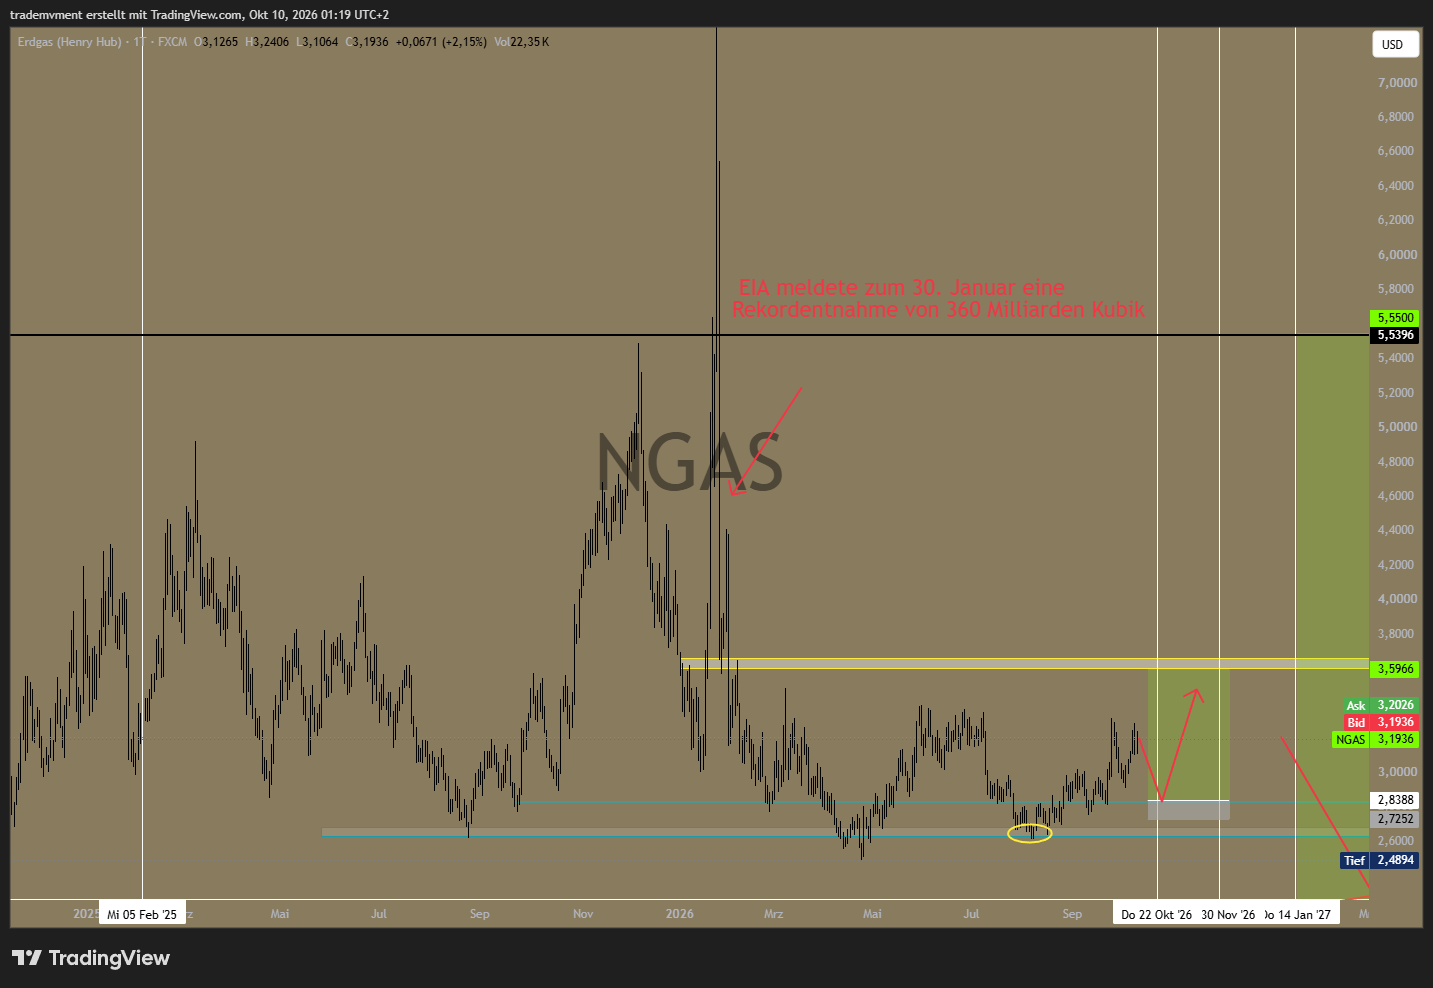
My assumption of cold weather remains a scenario, however. So far, the reports have tended to indicate above-average periods.
5. Why extreme price lows could prepare a later upward cycle
The economic side also matters to me. A weaker economy can weigh on industrial gas demand!!
If weakening demand, a mild winter and ample supply coincide, the price could initially come under strong pressure again.
Very low prices can then squeeze producers' margins. New drilling becomes less attractive; companies may curtail production or postpone projects. Some of these adjustments take effect with a lag. For example, the EIA described declining production in the first half of 2024 amid historically low prices, followed by lower storage injections.
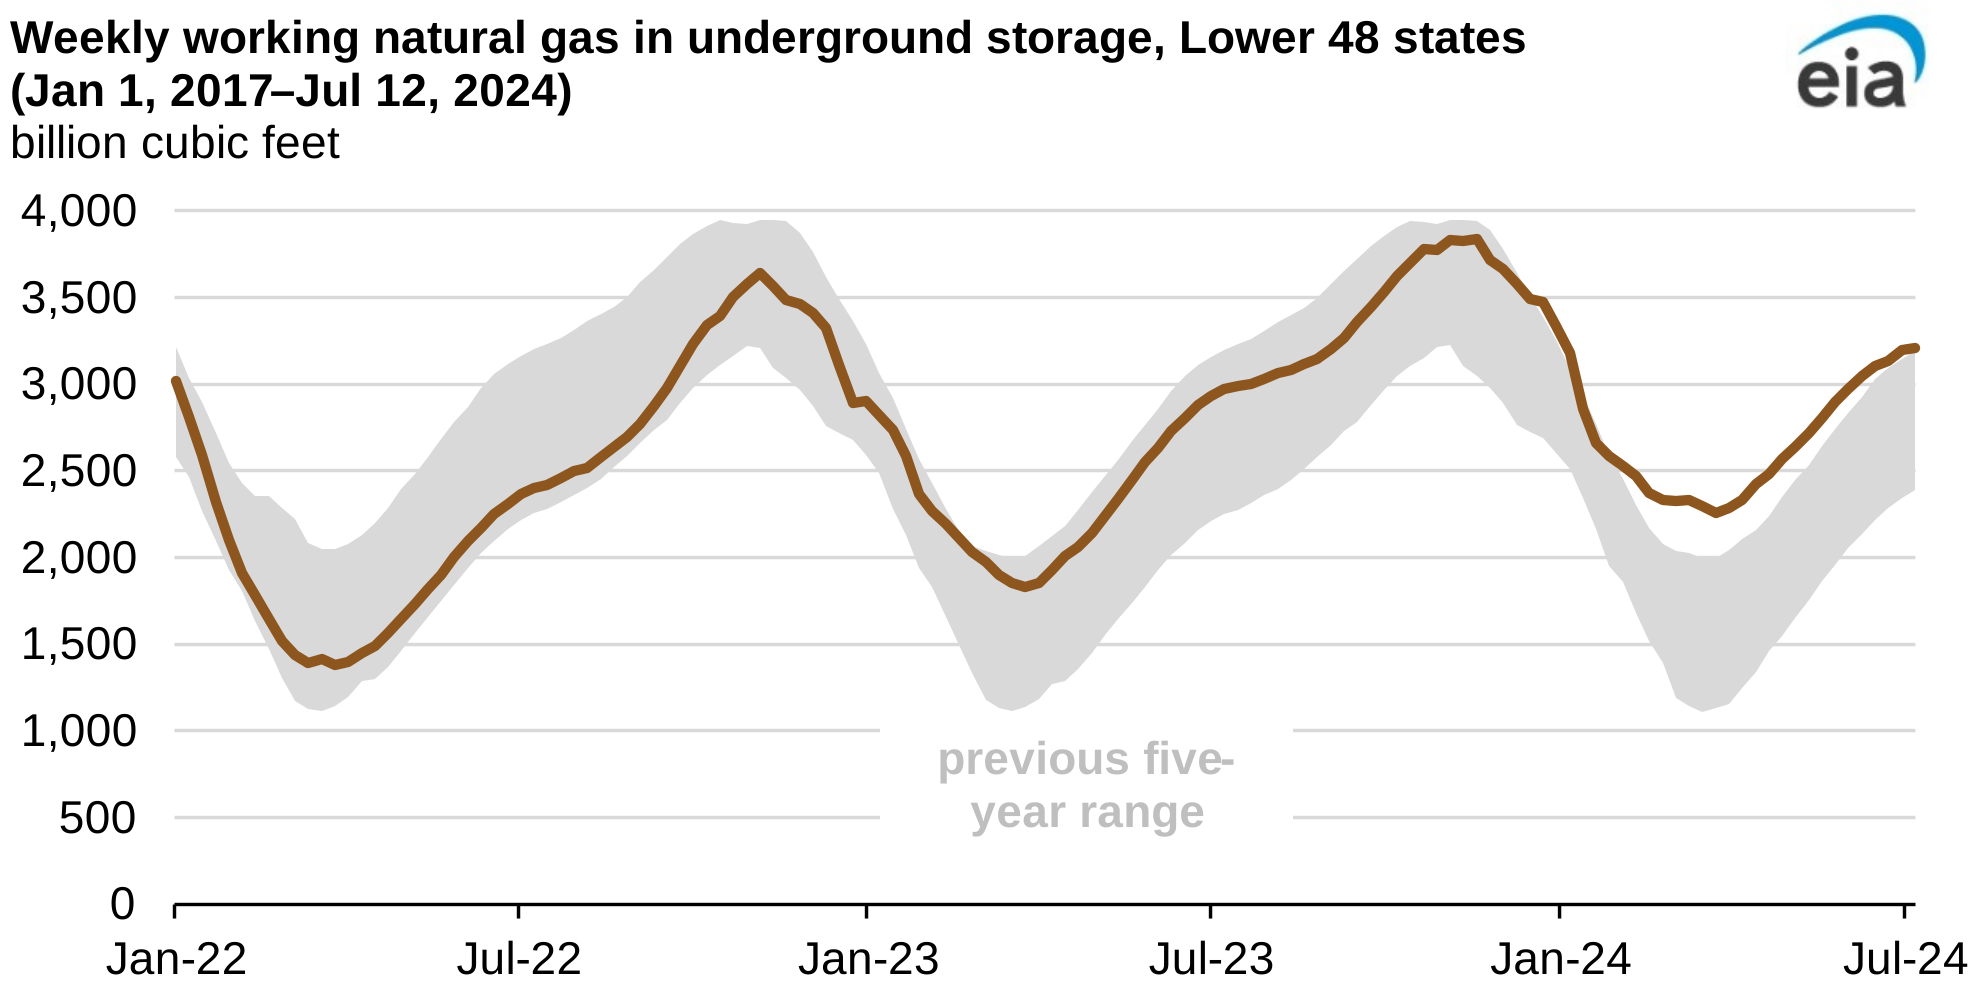
If stronger heating demand or rising demand for other uses later meets supply that is growing less quickly, a larger upward cycle could emerge.
Therefore: First oversupply and low prices, then supply adjustments, and later a stronger price response to renewed demand or extreme cold.
6. Long-term direction: Long with a horizon through 2029
From a significantly lower entry, I see potential for a larger upward move. In the
Sources for the economic and meteorological background:
EIA Weekly Natural Gas Storage Report — live report
EIA: Record storage withdrawal — 5 February 2026
EIA: Low prices, production and storage — 22 July 2024
NOAA CPC: Latest seasonal outlook — live page
Source review, 17 October 2026: The EIA weekly report and NOAA outlook are live pages. Their current contents may postdate this analysis. The latest NOAA outlook was issued on 15 October; it is not the outlook available when this analysis was published.
Source review · 17 October 2026
Links reviewed on 17 October 2026. Supplementary source figures were added during this review; the original publication date and TradingView charts are preserved.
The final paragraph ends mid-sentence in the original. It is preserved here.
Loading comments…