Australian dollar: Why I see more downside risk
Horizon: Late 2026 into early 2027

Economic research
I see more downside risk in the Australian dollar, even with interest rates elevated and further increases still possible.
Analysis prepared on 28 October 2026. Website edition published on 31 October 2026. Macro developments reviewed through 31 October; the supplied price, positioning and seasonal charts retain their 28 October reference point.
My concern is the economy underneath those rates. The labour market has less room to absorb pressure, consumer confidence is weak, and the latest household spending figures deserve attention.
My working thesis is that this tension could become increasingly important over the coming months. The rate level matters. So does the economy’s ability to sustain it, and the market’s expectations of what comes next.
The labour market has less room to absorb pressure
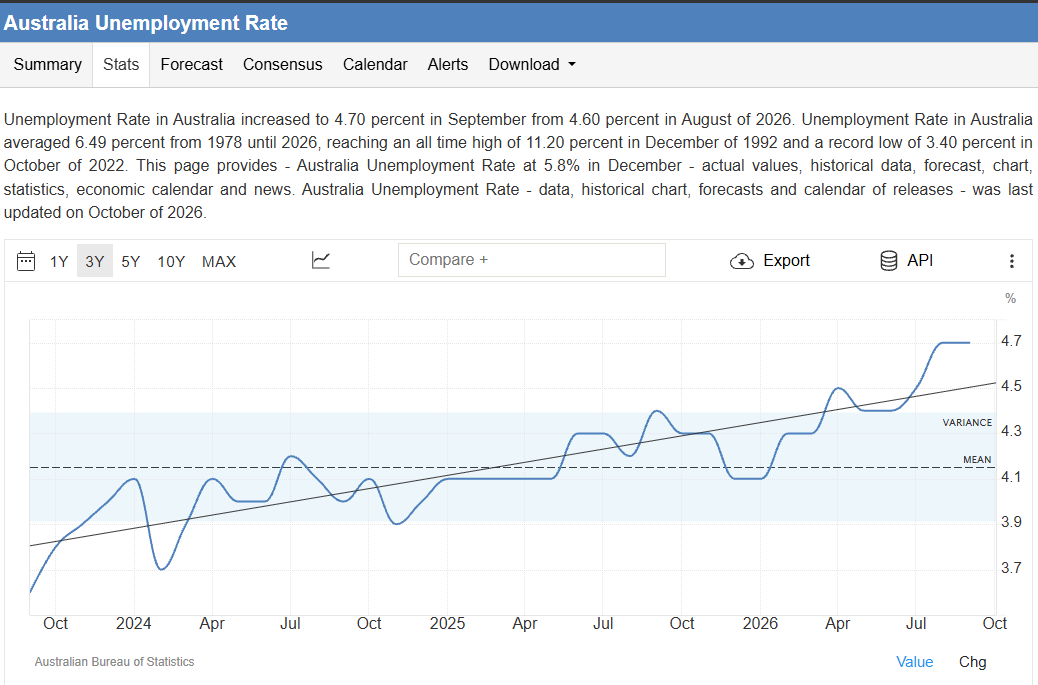
Australia’s unemployment rate has trended higher over the past few years, with temporary declines and periods of stability along the way.
In September, the seasonally adjusted unemployment rate stood at 4.7%. The participation rate fell to 66.8%. 1
The employment report delivered a clear negative surprise: 39,300 fewer people employed, against expectations for an increase of 20,000. That followed a revised gain of 29,300 in August. 2
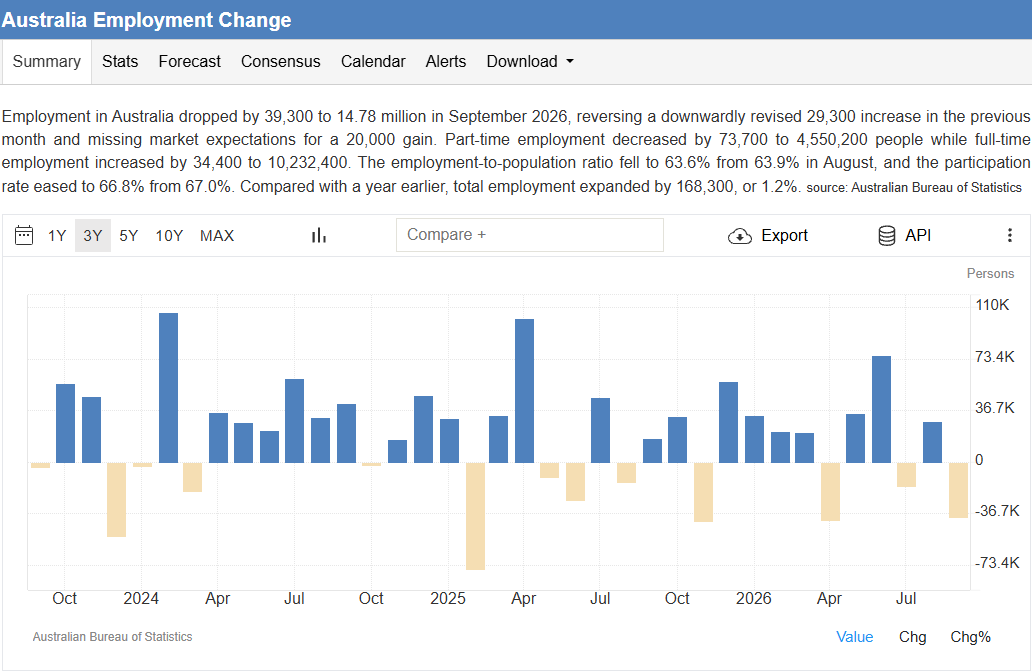
The composition matters. Full-time employment rose by 34,400, while part-time employment fell by 73,700. Hours worked edged higher, and total employment remained 1.2% above its year-earlier level. There are still resilient parts of this report. 1
One weak report needs confirmation
Monthly employment figures are volatile. Survey variation, seasonal adjustment and revisions can all affect the result.
A weak month can be followed by a recovery. That does not establish a reliable cycle in which negative reports automatically produce positive ones the following month.
For my thesis, the key is whether weakness broadens. Further increases in unemployment and repeated disappointments in hiring would strengthen my view. Several robust reports would weaken it.
Expectations can change before policy does
Markets respond to how new information compares with what was expected and already priced in.
If investors expect further rate increases, a weaker labour market could change their assessment of the future rate path. That repricing can begin while the actual cash rate remains unchanged.
This is the shift I am watching: how the balance between inflation, growth and employment evolves, and when that changes expectations of the RBA.
Inflation makes the RBA’s job harder
Australian inflation has picked up again from its 2025 lows. The path includes temporary declines and periods of stability.
The September figures released on 28 October show headline inflation at 4.3%, up from 4.0% in August. Trimmed mean inflation reached 3.6%, up from a revised 3.5%. 3
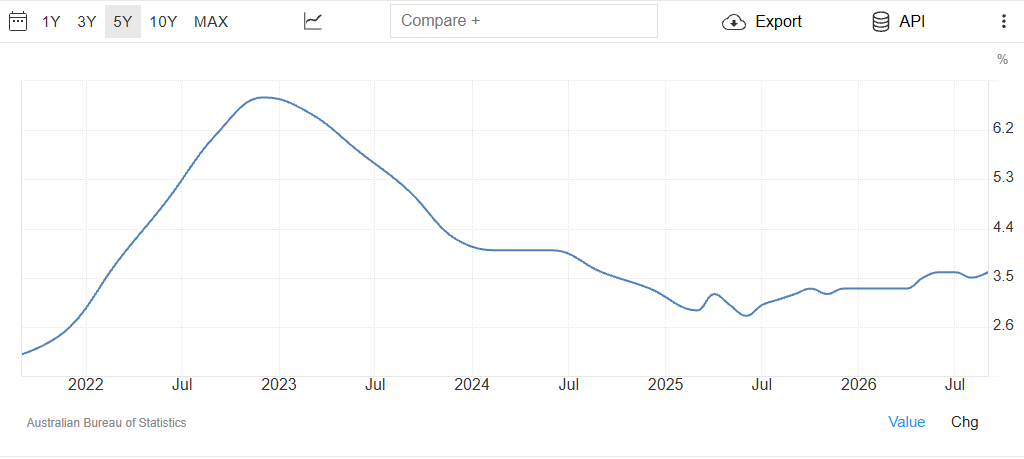
Both remain above the RBA’s 2–3% target range. The central bank raised its cash rate to 4.60% in September, bringing this year’s cumulative increase to one percentage point. 4 5
High inflation meets a more sensitive economy
On 28 October, Governor Michele Bullock said that inflation was likely to be higher than the RBA’s August baseline had assumed.
Alongside global energy and other cost pressures, the RBA still sees domestic capacity constraints. Weak productivity limits how quickly the economy can expand without adding inflation pressure. 5
This is the policy dilemma I am focused on. Further tightening aims to contain inflation. It also raises financing costs and can weigh on demand with a lag. According to the RBA, the full effects of the recent increases have yet to be felt. 5
My thesis is that the room for further tightening could narrow if employment and demand weaken more clearly. A later policy shift is part of my scenario. For now, the RBA’s communication explicitly leaves further increases open. 4
Growth continues. I am watching its durability.
Australia’s economy is still expanding. Real GDP increased 0.4% quarter on quarter in Q2, following 0.3% in Q1. Annual growth was 2.1%, while real GDP per person was broadly unchanged over the quarter. 6
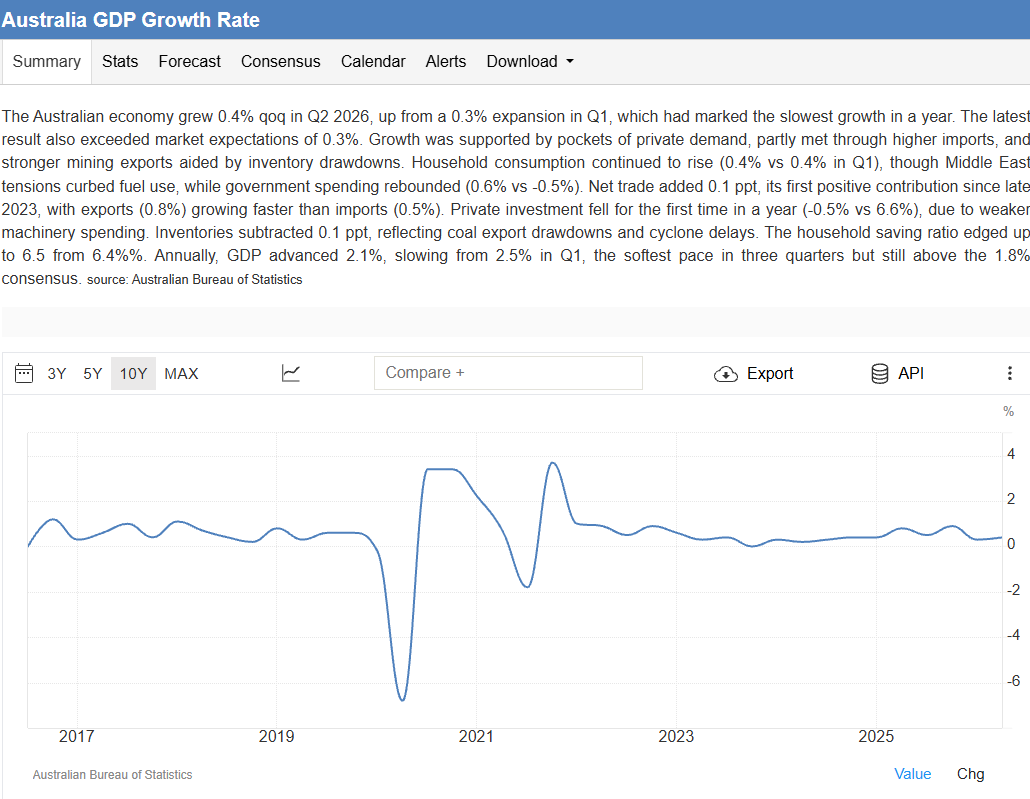
That is a moderate pace of growth. The figures do not show an uninterrupted decline from one quarter to the next.
For me, the question is how durable that growth will be as higher rates continue to work through the economy.
Household spending has paused
After rising 1.1% in July, household spending was unchanged in August. Spending on services and discretionary items each fell by 0.3%. 7
These are nominal, seasonally adjusted figures. Total spending was still 6.8% higher than a year earlier. A single flat month is insufficient to establish a lasting downturn in consumption. 7
It is a development I want to follow closely. A renewed expansion in spending would challenge my view. A broader slowdown would support it.
The economy runs on belief
The Westpac–Melbourne Institute Consumer Sentiment Index fell from 84.4 in September to 80.4 in October, a decline of 4.7%. Westpac highlighted fuel costs and the latest interest rate increase as pressures on sentiment. 8
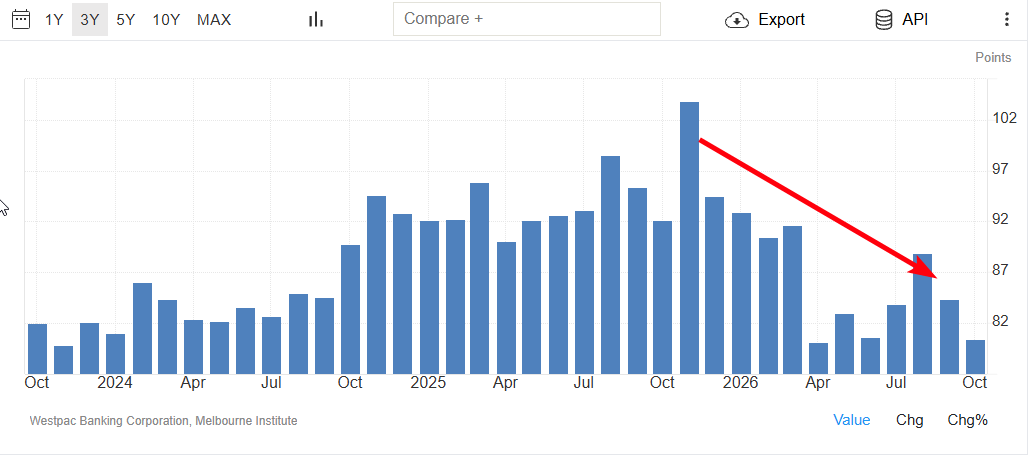
For me, this captures a simple idea: The economy runs on belief.
People make spending and investment decisions partly on the belief that their jobs will remain secure, their incomes will hold up and the future will justify taking a financial risk.
Confidence can affect behaviour
When households become less certain about that future, they may delay purchases and become more careful with their money.
If enough households do this together, businesses can feel it through weaker sales. That can influence investment and hiring decisions in turn.
A survey reading does not make this chain of events automatic. Income, wealth, borrowing costs and actual employment also matter. I still consider confidence a useful early signal, especially alongside a labour market with less room to absorb pressure.
China matters. The composition of growth matters too.
China accounted for around 29% of Australia’s goods and services exports in 2025. Its economic performance is therefore highly relevant to Australia, particularly through commodities such as iron ore. 9
The latest Chinese data present a mixed picture. They do not support a broad claim that imports, exports and GDP are all continuing to fall.
In September, goods exports in US dollar terms rose 36.3% year on year, while imports increased 31.0%. Both exceeded the Reuters consensus. These are nominal trade values, rather than pure measures of physical volumes. 10
Real GDP growth also strengthened to 4.5% year on year in Q3, from 4.3% in Q2. 11
Property and steel remain areas of concern
My concern is more specific: the parts of Chinese demand that matter for Australia’s commodity exposure.
From January to September, Chinese property investment was 20.6% below a year earlier, and newly started floor space fell 24.9%. Crude steel production declined 2.9% over the same period. 12 13
Credit data also require care. Outstanding yuan loans grew 4.8% year on year in September, while cumulative new bank lending over the first nine months was below the previous year’s level. Yet September lending recovered to 1.08 trillion yuan and exceeded expectations. 14
I am watching whether strength in selected sectors develops into a broader recovery in construction, steel and the commodity demand relevant to Australia. Further weakness there would be an additional risk for the AUD. A broader recovery would challenge my thesis.
I would not use these figures to claim that every metal or agricultural commodity is in decline. Those markets need to be assessed individually.
Retail positioning looks stretched relative to price
My reading is that the retail side still looks heavily positioned relative to the price. The highlighted build-up in the lower panel is another reason I remain cautious about the AUD.
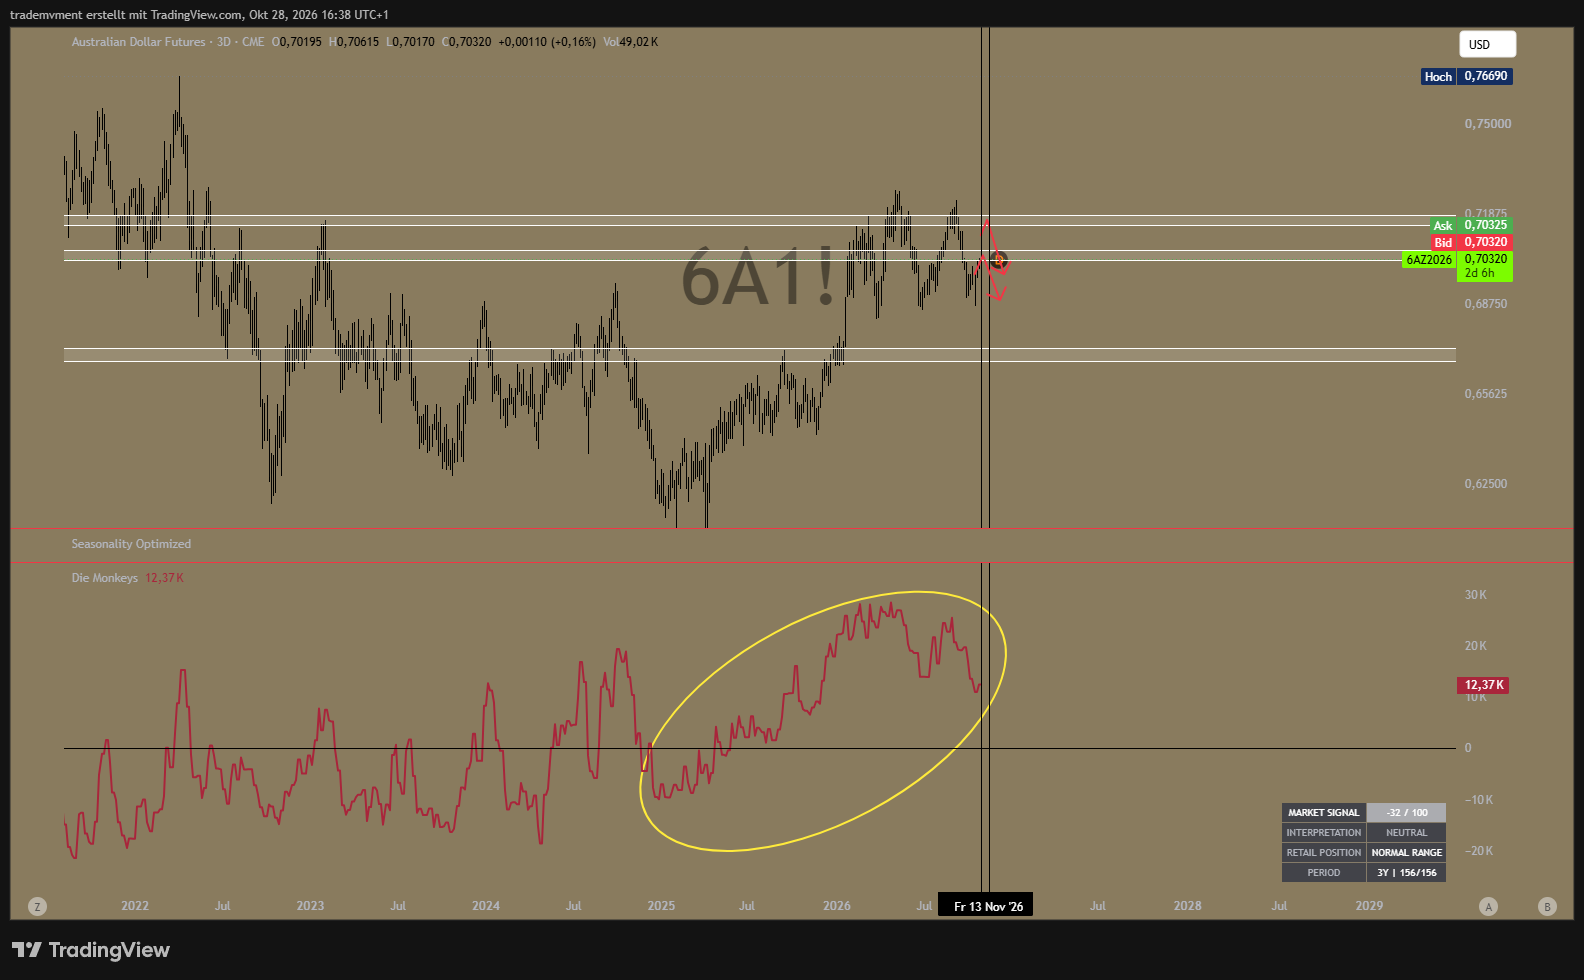
The indicator has risen substantially from its 2025 lows. Its displayed reading is around 12.37K, down from an earlier peak near 30K. Meanwhile, AUD futures remain below the upper marked resistance area.
Positioning has already cooled from its peak. Even so, I see a risk that the remaining positioning could unwind alongside renewed price weakness.
How an unwind could add selling pressure
If bullish exposure is reduced as price falls, long closures, triggered stops and liquidations could add selling pressure. That is the mechanism I am watching, rather than assuming that a positive indicator reading must force the market lower.
The stretched-positioning assessment is my interpretation of the relationship with price. The dashboard itself currently labels its market signal “neutral” and retail positioning “normal range.” It therefore does not classify the current reading as an extreme.
The screenshot does not identify the underlying dataset or units. I cannot translate 12.37K into a verified number of net-long contracts, individual traders or a leverage measure.
For me, this is a possible amplifier of the macro and chart setup. Further declines in the positioning series alongside price weakness would fit an unwinding scenario. A stable price while the indicator falls, or a sustained breakout above resistance, would weaken that interpretation.
The chart fits my working thesis
The chart I use here shows CME Australian dollar futures with three-day candles. The displayed price is around US$0.70 per Australian dollar. Futures and spot prices need to be considered separately when applying these levels.
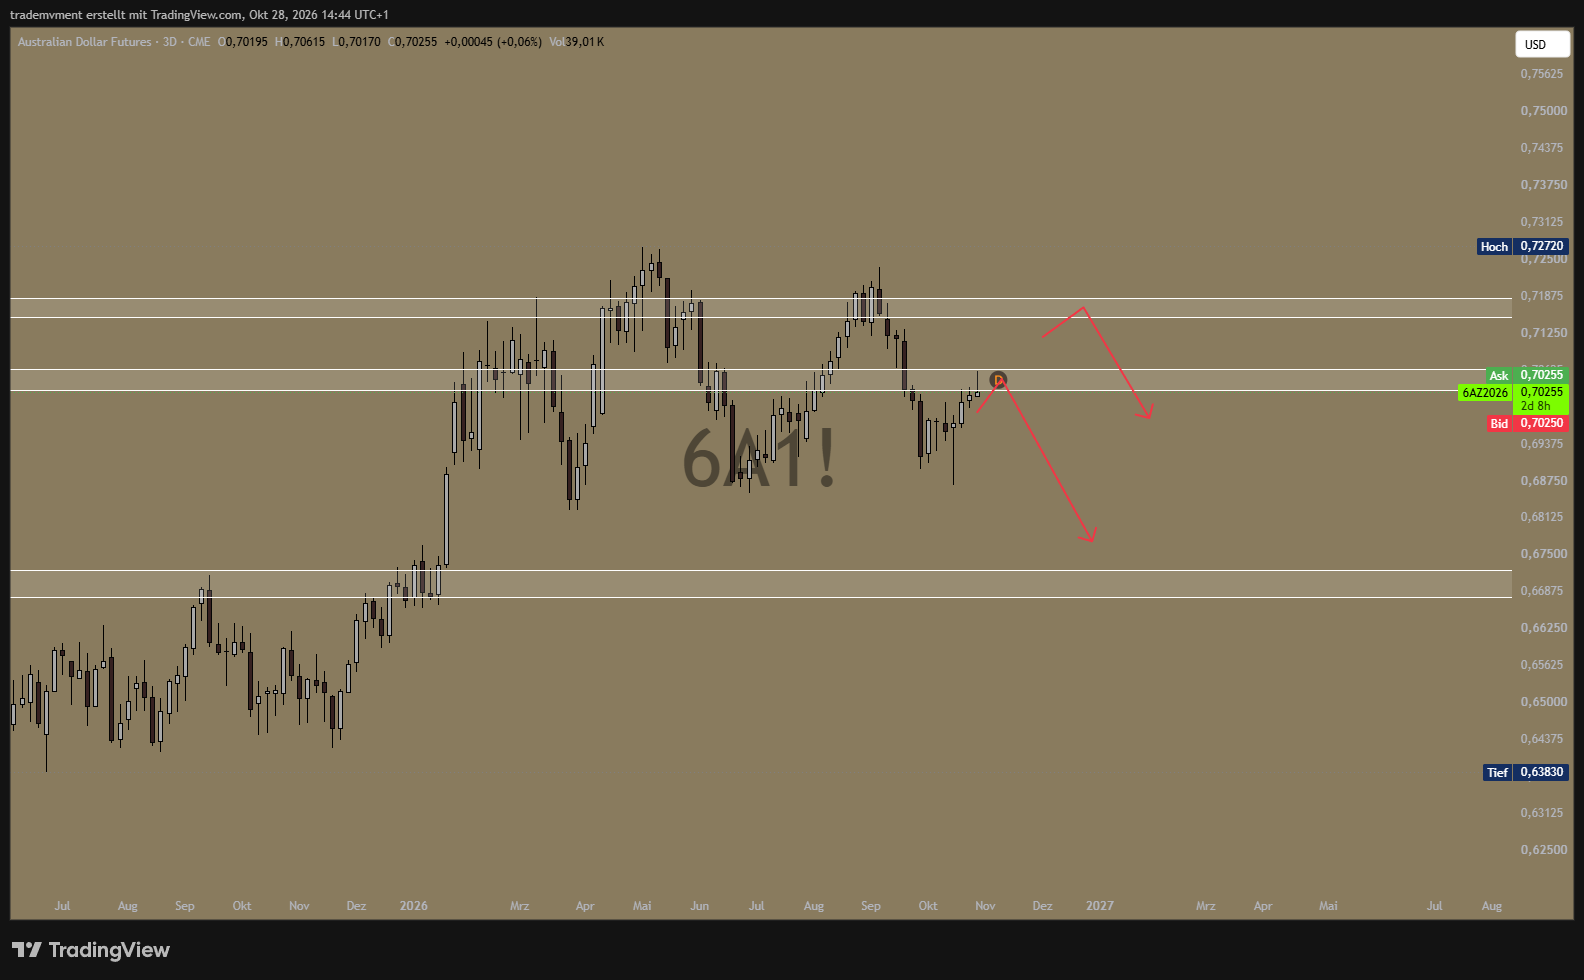
My working thesis is that the major highs of this advance may already be behind us. I interpret the broad consolidation as a possible distribution phase ahead of a move lower.
The marked areas sit roughly around 0.7025–0.7060, with a higher zone around 0.7150–0.7180. A lower area is marked around 0.668–0.672. These are approximate reference zones read from the chart.
Two possible paths
I am considering an earlier rejection near the current area, or a further recovery into the higher zone before a reversal.
The red arrows illustrate those scenarios. They do not establish the actual path or its probability.
A sustained recovery above the upper zone and subsequently above the previous highs would weaken my interpretation of this consolidation.
How I am looking to express the view
I am looking to express my bearish AUD view through shorts in AUD/CAD and AUD/CHF, with exposure split between the two pairs. The futures chart provides a reference for the broader Australian dollar view.
Seasonality gives me a window to watch
Parts of the seasonal chart suggest a late-year period that I want to monitor for potential short opportunities.
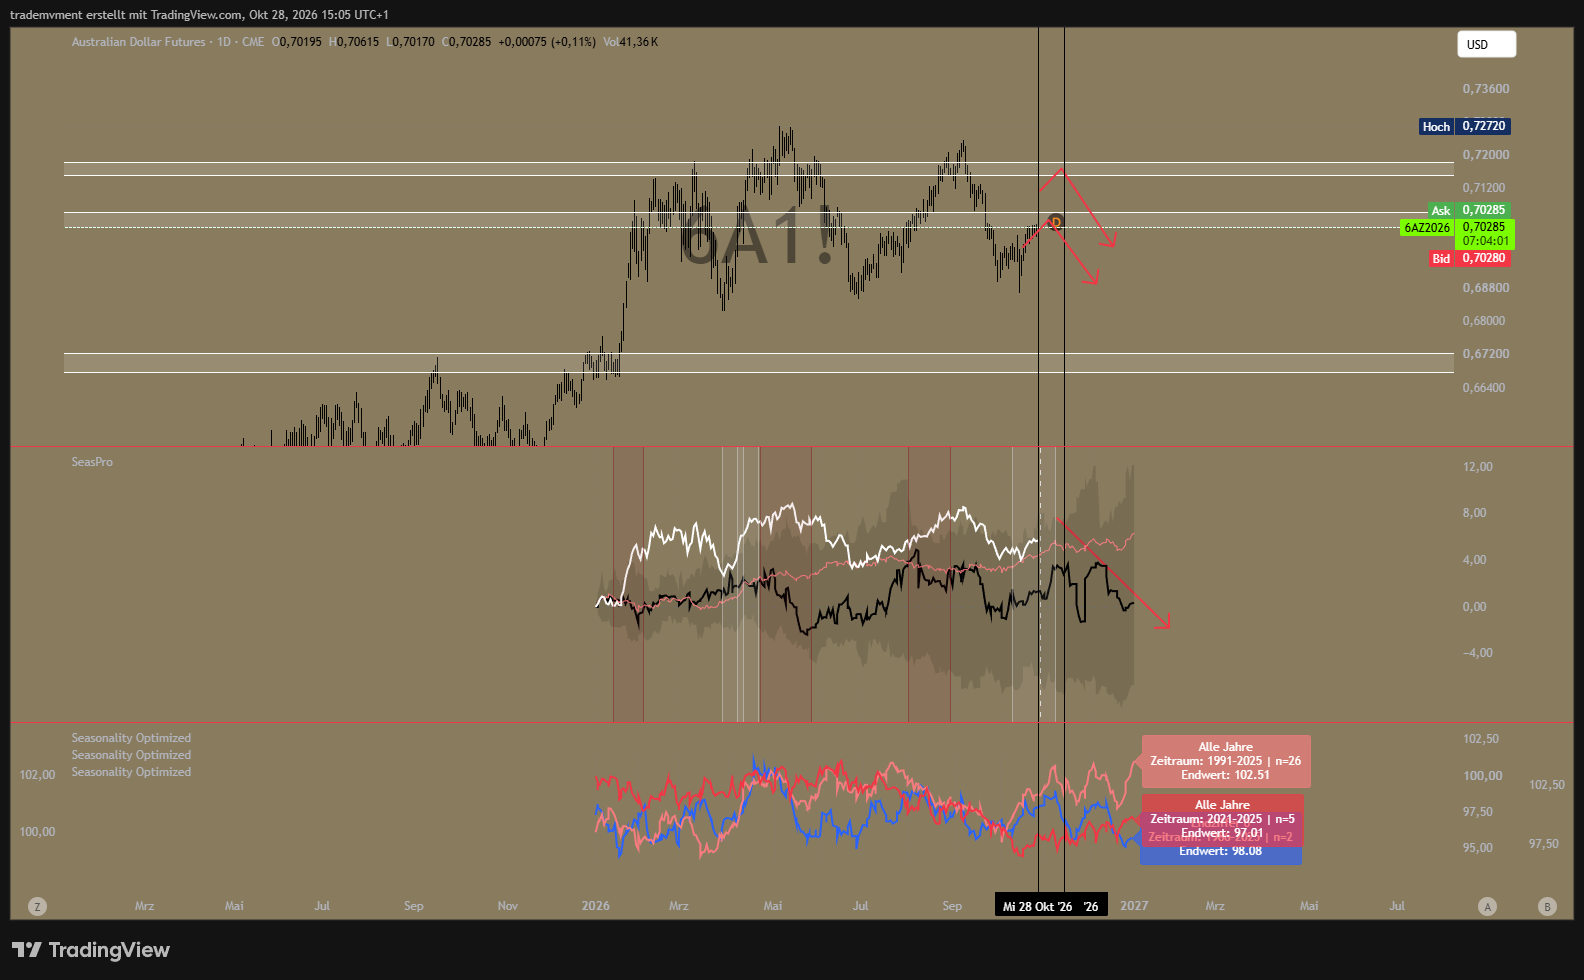
The samples show different paths. The more recent selections finish weaker, while the longer selection produces a different overall result. The smallest samples have particularly limited statistical weight.
I use seasonality as an additional timing input. A stronger claim about a specific trading window would require its historical returns, dispersion and hit rate. The screenshot alone does not provide that analysis.
What would strengthen or weaken my view
I see more downside risk in the AUD because several pressures could come together: a labour market with less room to absorb shocks, weak consumer confidence, the latest pause in nominal household spending and high rates still working through the economy.
Inflation remains high. That makes the adjustment harder. The RBA needs to restore price stability, while a further weakening in demand and employment could narrow its economic room for manoeuvre.
I expect this tension could become more important and lead the market to reassess the future rate path. The chart structure is consistent with that scenario in my view.
The evidence I will follow
My thesis would gain support from:
- Repeated disappointments in employment and household demand.
- A further rise in unemployment.
- Failed price recoveries around the marked chart zones.
- Further declines in the positioning series alongside weaker price action, consistent with an unwinding scenario.
It would weaken with resilient full-time employment, sustained spending growth, a broader Chinese recovery or a sustained break above the previous price highs.
A move lower remains my working thesis. The next data releases and price action will determine whether it earns further support.
Related currency analysis
Canadian dollar: Why I see more upside into year-end
Sources
- 1. ABS: Labour Force, September 2026
- 2. Trading Economics: Employment Change and market consensus
- 3. ABS: Consumer Price Index, September 2026, released 28 October
- 4. RBA: Monetary policy decision, 29 September 2026
- 5. RBA: Michele Bullock testimony, 28 October 2026
- 6. ABS: National Accounts, June quarter 2026
- 7. ABS: Monthly Household Spending Indicator, August 2026
- 8. Westpac: Consumer Sentiment, October 2026
- 9. DFAT: China country brief and 2025 trade relationships
- 10. Reuters: Chinese trade, September 2026, published 14 October
- 11. NBS: Q3 2026 GDP, published 21 October
- 12. NBS: Property investment, January–September 2026
- 13. NBS: Industrial production, September 2026
- 14. Reuters: Chinese bank lending, September 2026, published 14 October
Loading comments…