Canadian dollar: Why I see more upside into year-end
Horizon: Into year-end 2026

Economic research
The Canadian dollar is one of the currencies where I currently see more room to the upside.
Analysis prepared on 28 October 2026. Website edition published on 31 October 2026. Macro developments reviewed through 31 October; the supplied price, positioning and seasonal charts retain their 28 October reference point.
Publication update, 31 October: The GDP section now reflects the full August release and September advance estimate. The European energy section includes the completed Canada–EU summit. These additions leave my directional view conditional on the evidence described below.
My view brings together several developments: a price still well below its recent highs, firmer retail spending and exports, Canada’s growing strategic relevance as an energy supplier, and positioning that could support a recovery if bearish exposure starts to unwind.
The Bank of Canada’s 28 October decision adds another element: the policy rate rose by 25 basis points to 2.50%. The Bank also left further increases possible, while stressing that it would proceed carefully. 1
I remain constructive on CAD into year-end. The case depends on further resilience and positive surprises, with employment and global demand among the biggest tests.
A low starting point leaves room for expectations to change
On my Canadian dollar futures chart, price is around US$0.7140 per Canadian dollar, following a rebound from the marked low near 0.70145. It remains below the higher trading areas visible earlier in the chart.
That starting point matters to me. I see an opportunity for expectations to improve if Canadian data hold up better than the market anticipates.
A low price alone cannot establish fair value or prove that CAD is cheap against every other currency. My preference comes from combining this chart structure with the economic and positioning evidence.
The question I am watching is whether the next change in expectations can favour Canada. A recovery in the data, a firmer expected rate path and reduced bearish positioning could reinforce one another.
Europe’s energy needs give Canada strategic relevance
One part of my broader macro view is that several economies may experience demand destruction over the coming months. I am particularly attentive to Europe, where access to reliable imported energy and functioning trade routes remains an economic vulnerability.
Canada’s position as a net energy exporter is relevant in that environment. The Bank of Canada has explained that Canada can fare better than economies heavily dependent on imported energy, although the domestic benefits of supply-driven energy shocks can be modest. 2
For me, this creates a reason to follow Canada’s relationship with Europe more closely. Energy security can influence commercial agreements, infrastructure investment and the value placed on reliable suppliers.
What the new European LNG agreement actually covers
On 27 May 2026, Canada announced an agreement between Ksi Lisims LNG and Germany’s SEFE for one million tonnes of LNG annually for up to 20 years. Deliveries are expected to begin in the early 2030s. The announcement makes the arrangement conditional on finalising a definitive sales and purchase agreement. 3
The relationship also extends beyond this individual project. At a June energy-security roundtable, the EU and Canada discussed LNG, electrification, clean technologies and the investment conditions needed to develop supply chains. A separate workshop connected Canadian LNG projects with potential European buyers. 4
For my year-end thesis, the possible transmission is through expectations for investment, diversification and future market access. The planned LNG deliveries do not add to Canada’s 2026 export revenues.
At the 29–30 October Canada–EU summit, leaders launched work towards an Alliance for the Future. Energy commitments include deeper cooperation and a joint feasibility study on LNG exports to Europe, alongside closer port and supply-chain links. These are cooperation and development commitments; their economic effect depends on subsequent investment, agreements and capacity. 5
The global-demand risk still matters
There is a tension within my own outlook. A weaker global economy could increase the appeal of reliable energy partners, while simultaneously reducing demand for Canadian exports.
A severe contraction could lower commodity prices, weaken non-energy exports and increase demand for the US dollar. Higher fuel costs also squeeze Canadian households. The BoC’s analysis highlights several reasons why an oil supply shock may deliver limited growth benefits and limited CAD appreciation. 2
My constructive view therefore depends on Canada benefiting relatively from diversification while avoiding a deeper deterioration in demand. Global demand destruction is a risk to this thesis as well as part of its geopolitical backdrop.
Growth and trade show areas of resilience
Canada’s real GDP increased 0.8% quarter on quarter in Q2, following a revised 0.1% increase in Q1. That Q2 expansion is equivalent to 3.3% at an annualised rate. Exports, household spending and business investment supported the improvement. 6 7
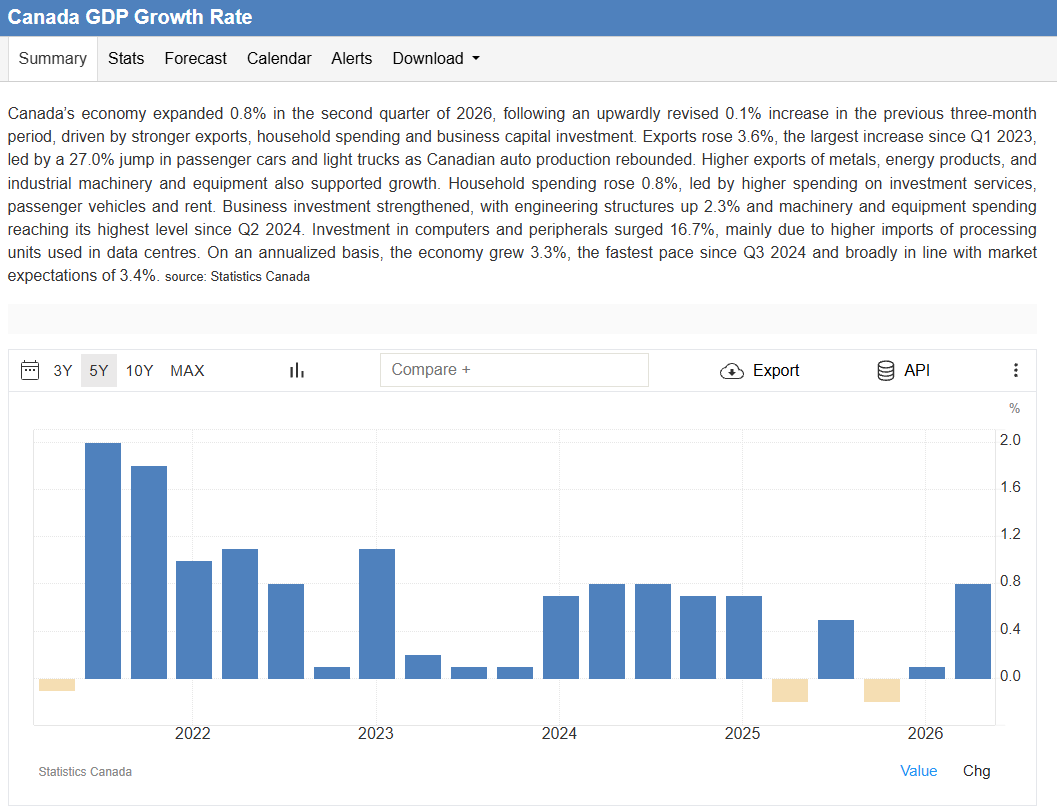
The quarterly chart gives my constructive view some support: activity accelerated after a weak start to the year. I see that improvement as a base to build on, with the next releases testing its durability.
The monthly picture is weaker than the early estimate available when I developed this thesis. The 30 October release showed flat GDP in August, following a flat July. It replaced the earlier +0.2% advance estimate. September’s advance estimate points to a 0.1% decline and remains preliminary. 8
The monthly industry data suggest 0.3% growth quarter on quarter in Q3. The official quarterly expenditure-based estimate is due on 30 November. This uneven activity raises the bar for my constructive view: the next releases need to show that the mid-year recovery can continue. 8
The trade surplus is a supportive part of the picture
In August, Canadian merchandise exports rose 2.5%, while imports fell 2.0%. The goods trade surplus widened to C$4.2 billion, from C$787 million in July. Energy exports increased 4.7%. 9
These figures support my view that the external sector still has areas of strength. I also want to see that strength become more durable and broadly distributed.
There are reasons for caution: exports to countries other than the United States fell 8.5% after July’s record, and Statistics Canada notes that anticipated US tariffs may have encouraged shipments to be brought forward. A larger surplus partly driven by lower imports also needs a different interpretation from one driven entirely by stronger demand. 9
Retail spending gives my consumption view something concrete
The latest full retail report is one of the more encouraging releases for my thesis. In August, retail sales rose 1.2% month on month in both nominal and volume terms. Core retail sales, excluding motor vehicles and fuel-related retailers, increased 1.1%, after falling 0.7% in July. 10
That distinction matters: the August improvement included an increase in the volume of purchases. It offers evidence of firmer activity beyond a rise in the amount of money spent.
The advance September estimate points to another 0.7% increase. It is an unofficial, revisable estimate, with the full release due on 20 November. I see it as an encouraging indication that still needs confirmation. 10
What I am looking for during the holiday period
I expect the November and December shopping period could help spending momentum. However, the official retail figures are seasonally adjusted: the normal Christmas shopping pattern is already accounted for. 10
For that period to strengthen my CAD thesis, spending needs to outperform the usual seasonal pattern or the expectations already reflected in prices.
My focus is on a better-than-expected consumer, with sustained growth in spending volumes. A calendar-driven rise in unadjusted sales would offer much less information.
Confidence has room to improve; employment has to stabilise
I see potential for Canadian sentiment to recover from a subdued starting point. The BoC’s Q3 consumer-expectations indicator edged higher, with modest improvements in perceptions of financial health and the labour market, while remaining low. Spending intentions weakened further. 11
That supports a possible recovery scenario, while leaving a clear gap between better sentiment and stronger spending plans. Most survey responses were also collected before Canada–US trade talks broke down on 21 August. 11
The economy runs partly on confidence. When households feel more secure about their jobs and finances, they may become more willing to spend. If uncertainty persists, they can continue to defer purchases even when their financial position improves.
Unemployment has improved from its spring peak
The unemployment rate fell from 6.9% in April to 6.4% in July and August, before rising to 6.5% in September. The latest increase interrupted an earlier improvement. 12
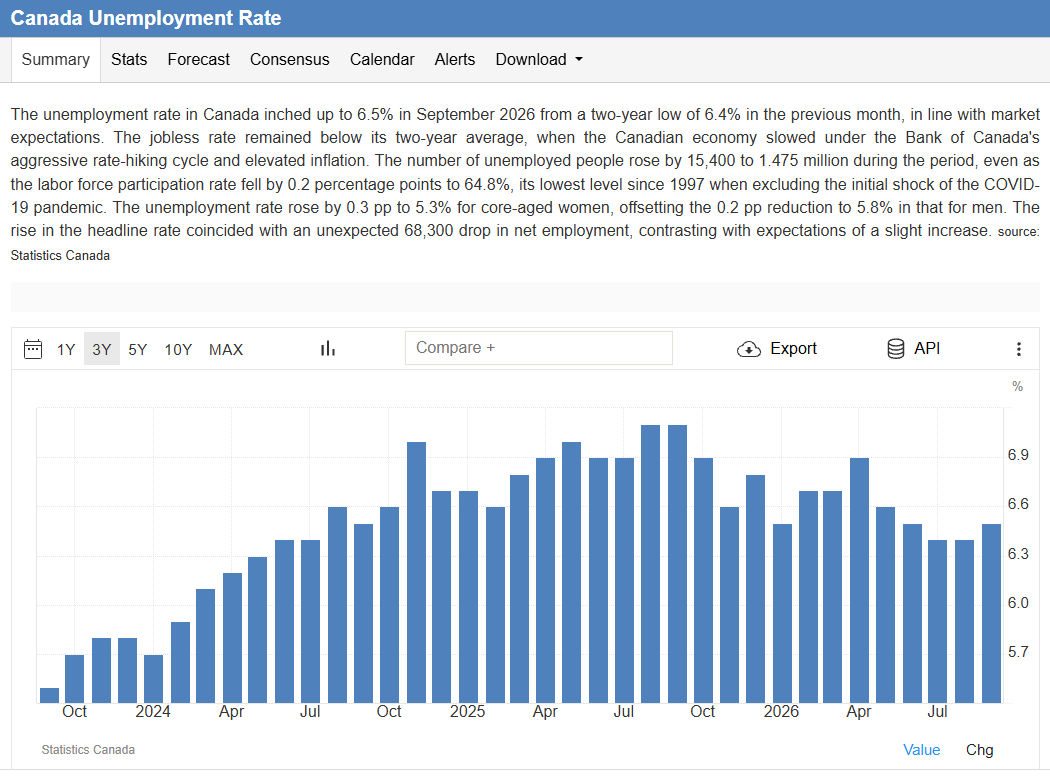
That broader context matters to my view. The chart leaves room for a stabilisation scenario, while September’s setback shows that the recovery in the labour market remains fragile.
My positive employment expectation remains a forecast
Employment fell about 68,000 in September, after a decline of about 42,000 in August. Both full-time and part-time employment declined in September. 12
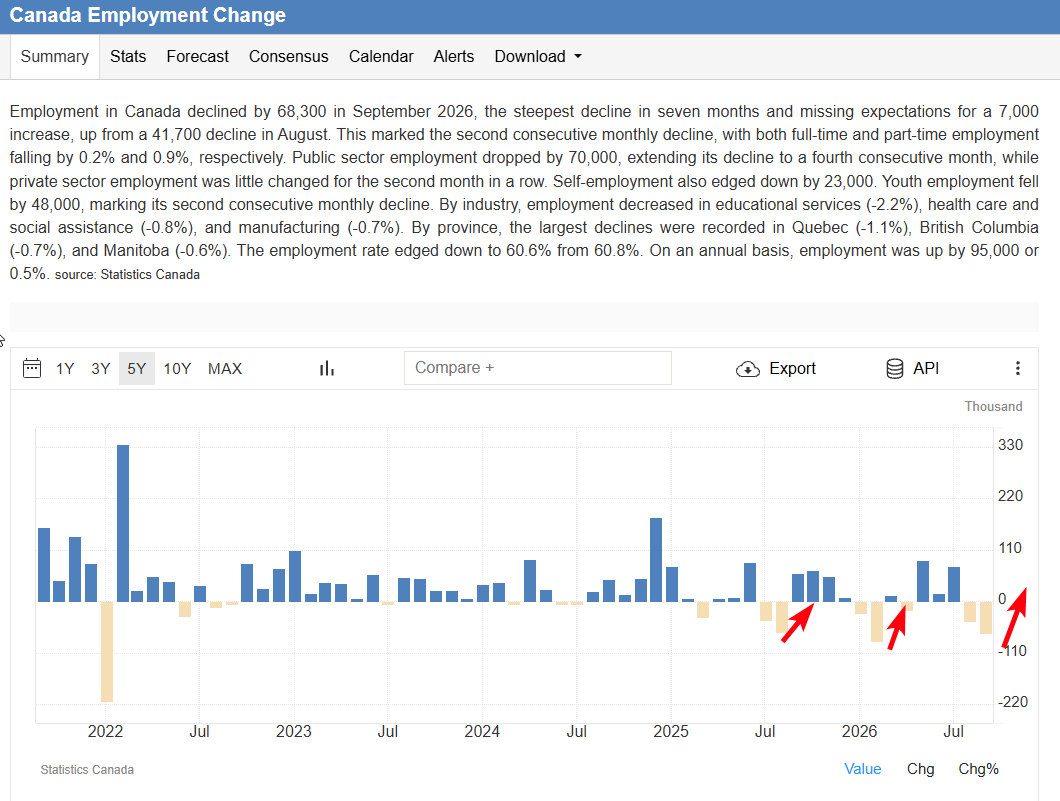
The public sector accounted for a large part of the September weakness, with employee numbers down 70,000; private-sector employment was broadly unchanged. This helps explain the composition, while leaving the overall decline significant. 12
Earlier negative readings on the chart were sometimes followed by positive months. That is part of what informs my expectation of a rebound. September was already the second consecutive decline, however, so a weak release does not mechanically produce a stronger next month.
I expect better employment figures in the coming releases, potentially above consensus. The red arrows illustrate the rebound scenario I am watching. The next labour report, due 6 November, will be an important test of that expectation. 12
A strong rebound could shift the discussion toward resilience. Further losses would weaken my confidence in the consumer outlook and in Canada’s ability to absorb additional tightening.
Inflation and the BoC: a firmer path, with economic costs
September headline CPI inflation was 3.1% year on year, up from 3.0% in August. Prices rose 0.1% month on month unadjusted, or 0.4% seasonally adjusted. Both the monthly and annual changes remained positive. 13
The composition is important. Inflation excluding gasoline was 2.2%. The BoC’s preferred core measures were 1.8% for CPI-trim and 1.9% for CPI-median. This is an elevated headline reading with much calmer underlying measures. 13 14
On 28 October, the BoC raised its overnight target to 2.50%. It cited the risk that persistently high energy costs spread more broadly through the economy, and said further increases could be needed. 1
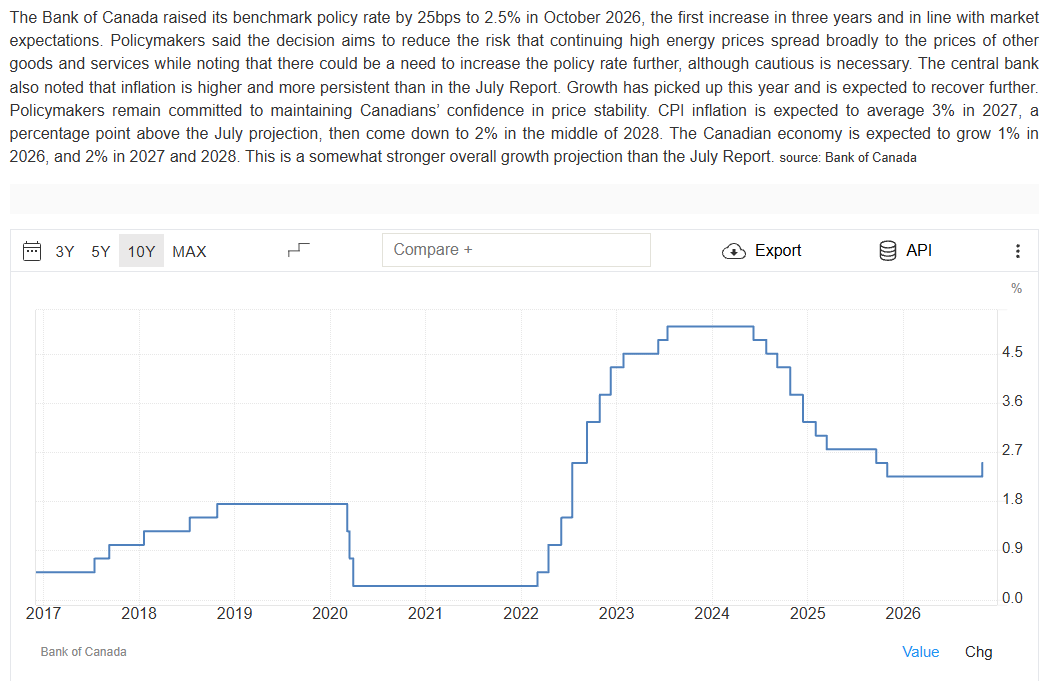
The rate chart makes the change in direction visible: the latest increase follows an extended easing phase. I am watching whether that first upward step develops into a firmer expected rate path as the next data arrive.
Why I still see potential for a firmer rate outlook
My view is that a resilient consumer, stronger exports and stabilising employment could give the BoC room to maintain a firmer policy path over several quarters. That combination could support CAD if markets revise future Canadian rates upward relative to their existing expectations and to other economies.
The BoC’s 28 October communication gives this possibility a policy basis. The Bank expects headline inflation to rise to about 3.5% by year-end, remain around or above 3% through much of 2027, and return close to 2% by the middle of 2028. Those are central-bank projections. 7
Additional hikes carry costs. The BoC still sees spare capacity, expects new US tariffs to slow Q4 growth and considered holding rates as well as raising them. Macklem’s explanation makes clear that the next decisions remain sensitive to the balance between inflation risk and economic weakness. 7
I see room for a more constructive rate outlook if the economy delivers. A low starting rate on its own cannot establish how much tightening households and businesses can withstand.
COT: improving gross longs, with a large short position still open
For positioning, I am watching the change in exposure as closely as the headline net position.
On my supplied chart, the non-commercial gross-long line has recovered from its September low, while a substantial gross-short position remains outstanding. I interpret that as an early improvement that could matter if price continues to strengthen.
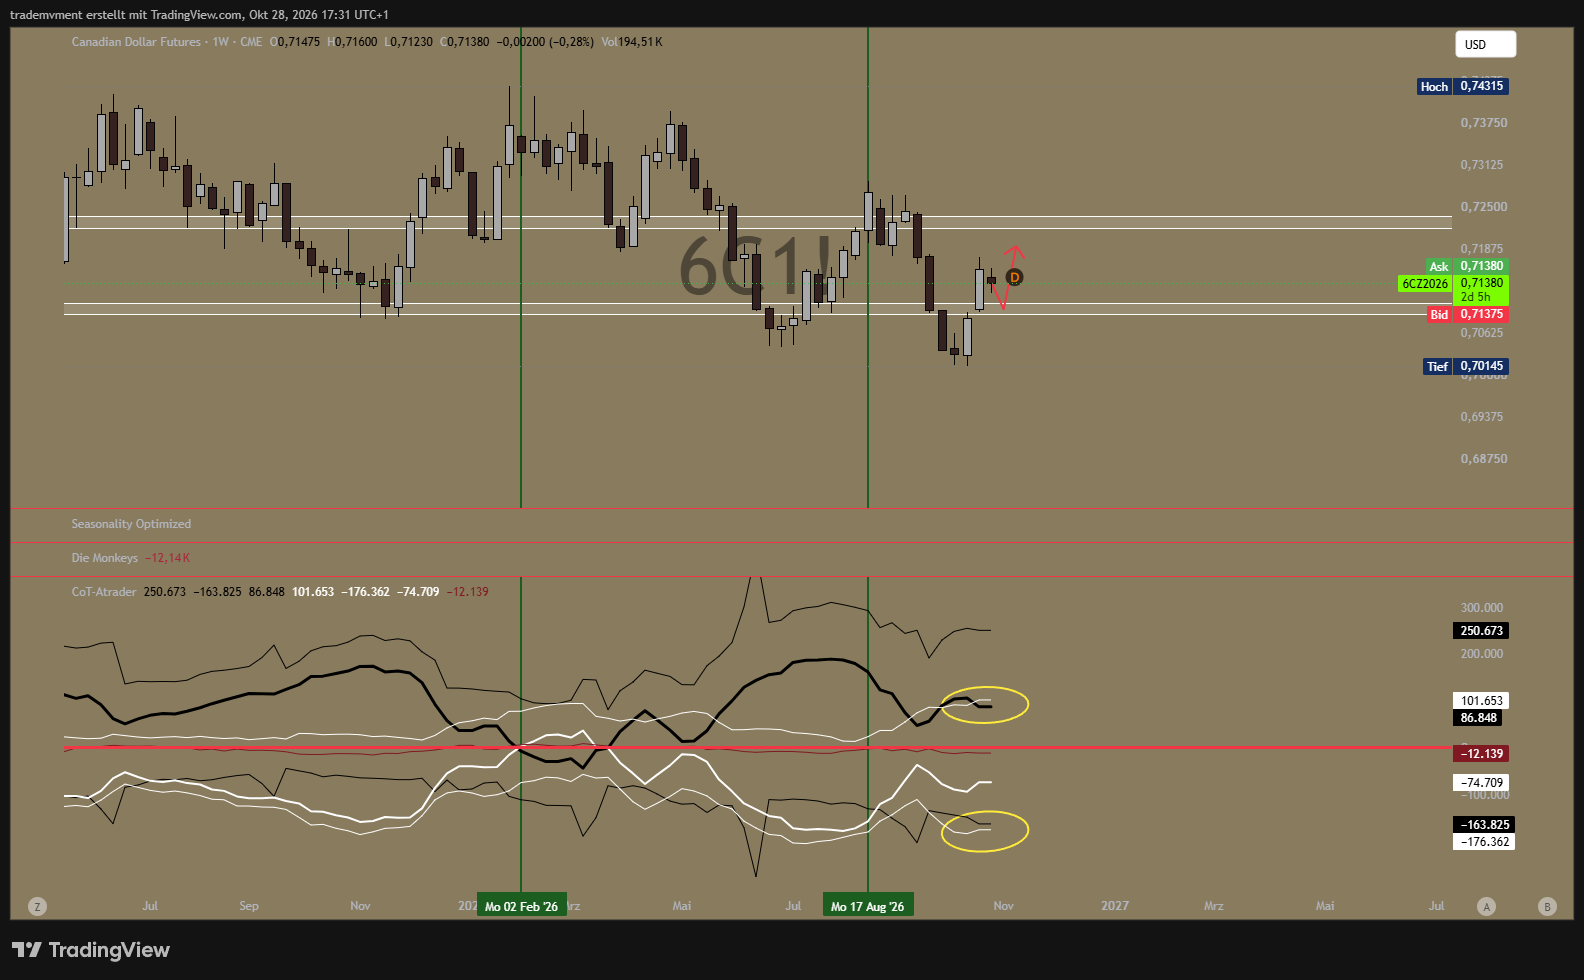
Using the chart’s black-commercial and white-non-commercial mapping, the displayed totals are:
- Commercials: 250,673 long, 163,825 short, giving a net position of +86,848.
- Non-commercials: 101,653 long, 176,362 short, giving a net position of −74,709.

These are readings from the supplied indicator snapshot. The supplementary CAD row is labelled Legacy Futures Only and repeats these long, short and net totals. Neither screenshot displays the underlying report date. COT data normally describe Tuesday positions and are released on Friday, so the chart-capture date should not be treated as the position date. 15
What could turn that exposure into an upside driver
The non-commercial category remains substantially net short. That leaves a possible source of buying if fresh demand arrives and existing shorts begin to cover.
I also see a recovery in commercial gross longs from their September decline. However, commercial shorts have increased recently too. Commercial activity often reflects hedging, while non-commercials include strategies beyond trend following; neither group is a single directional investor. 16
My constructive reading is the recovery in long exposure alongside a sizeable remaining short position. For it to matter, I want to see higher prices and a sustained change in subsequent reports.
Retail positioning: potential fuel for a short unwind
The smaller-trader proxy on the chart reads −12,139, which is consistent with a net-short position. I see possible fuel for an unwind if CAD strengthens and bearish participants reduce their exposure.
The arithmetic provides a clue about the series: the commercial and non-commercial net positions sum to +12,139, precisely offset by that red reading. This suggests the indicator may represent the non-reportable COT residual. It does not establish a comprehensive picture of retail FX accounts.
The CFTC defines non-reportable positions as the residual after reportable positions are subtracted from total open interest. The identities and commercial classifications of those traders are unknown. 16
My interpretation is therefore conditional: bearish smaller-trader exposure could add to an upward move through short covering. This chart does not establish an extreme relative to its full history, the amount of leverage, or the price levels at which forced liquidations would occur.
The chart: a possible retest before another move higher
My technical scenario allows for another dip into support before a renewed recovery. The supplied chart shows CME Canadian dollar futures, quoted in US dollars per CAD. A rise here generally corresponds to a fall in USD/CAD; the price levels below belong to the futures chart.
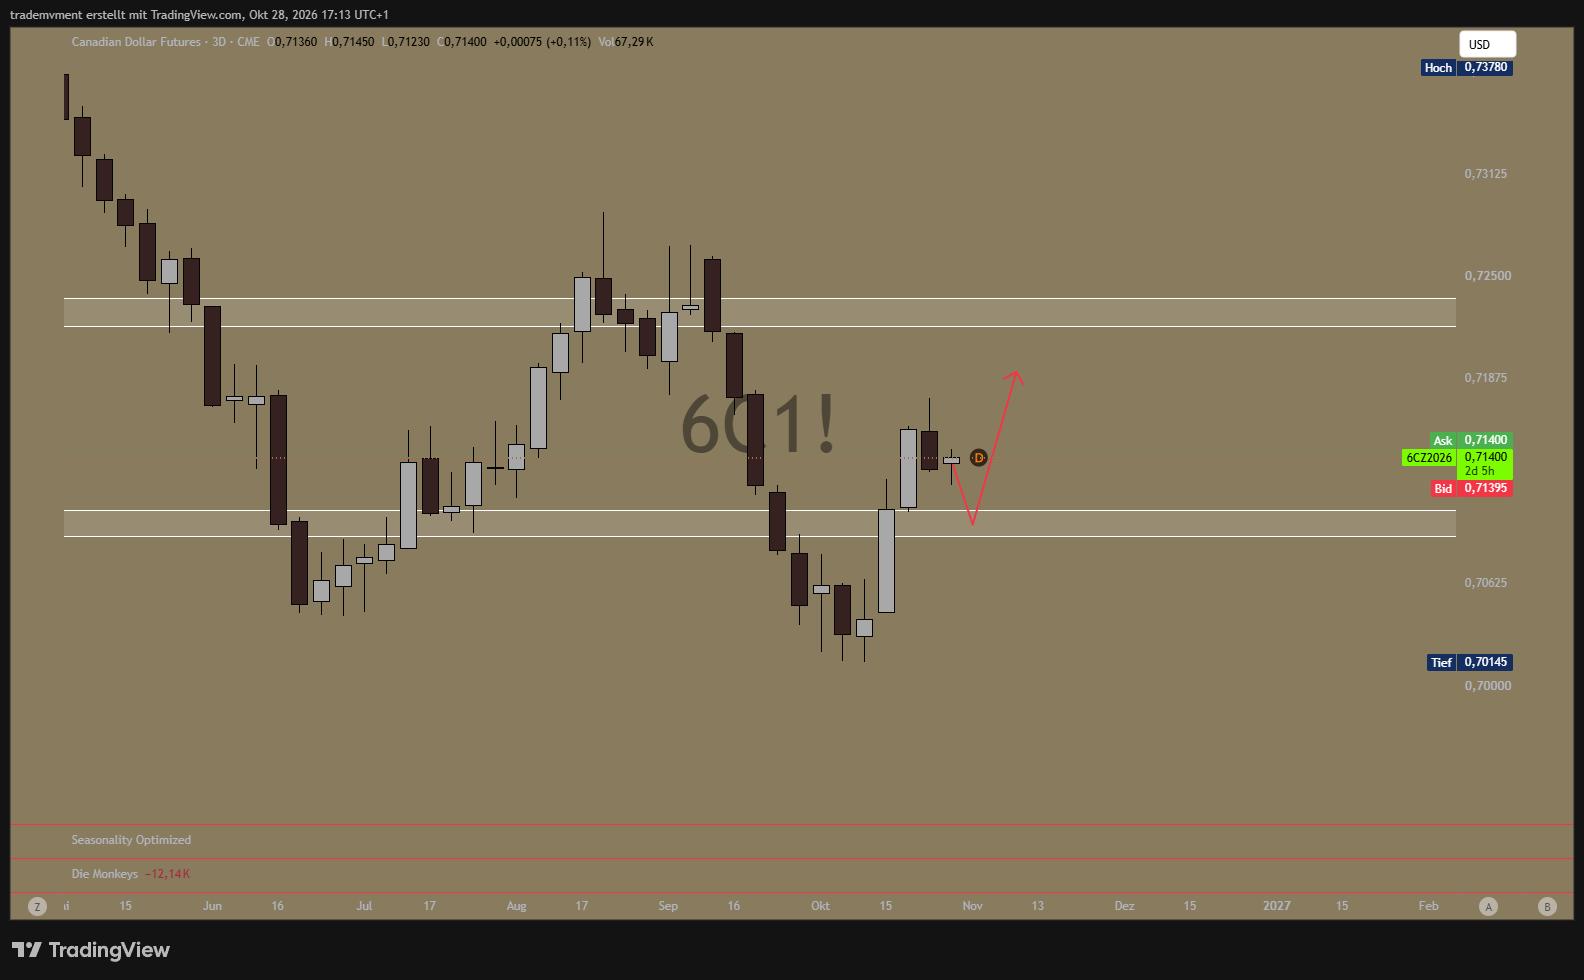
The areas I am watching are:
- 0.7090–0.7110: the approximate lower support zone marked on the chart.
- Around 0.7190: the initial recovery area suggested by my drawn scenario.
- 0.7220–0.7240: the higher resistance zone that would test a more sustained recovery.
- 0.70145: the marked recent low; a sustained break below it would materially weaken this chart-based recovery scenario.
I would look for evidence that buyers can defend a retest and then build upward momentum. The red arrow expresses a possible path, with both the retest and the recovery still requiring confirmation.
Seasonality: a headwind with narrower windows to watch
The broader seasonal backdrop is less supportive of my CAD view. I am watching shorter windows, especially early November, and considering how the US midterm-election context may affect the comparison.
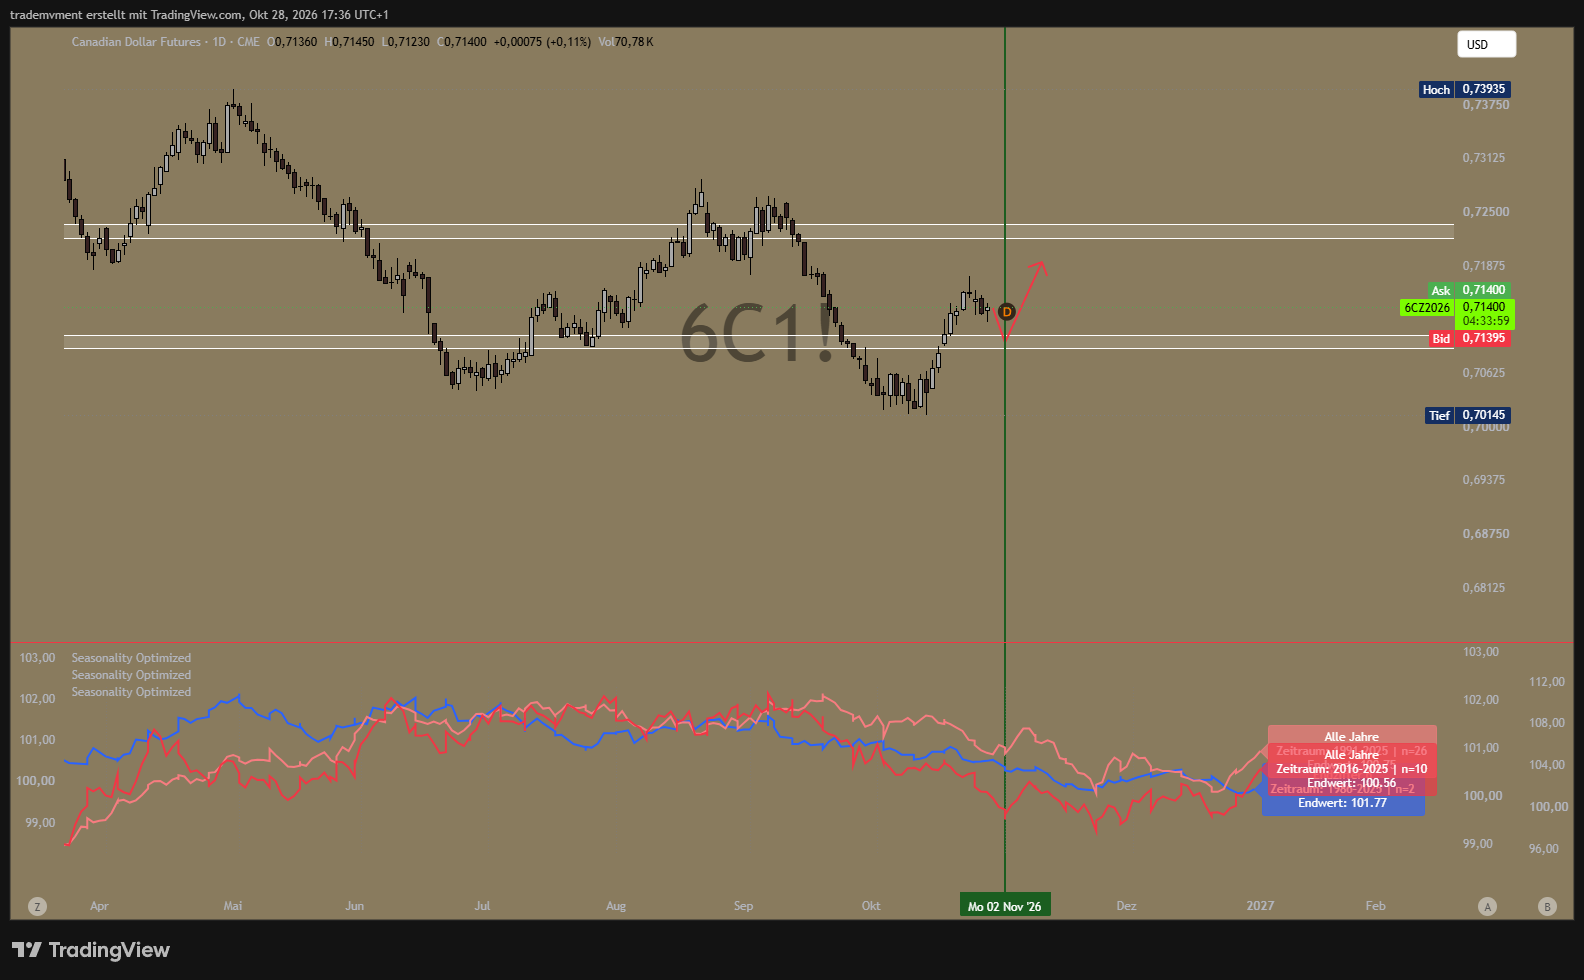
The displayed samples produce different paths. The visible labels show sample sizes of 26, 10 and 2 observations. Overlapping labels obscure part of the filtered-series description, so the screenshot alone cannot confirm that it isolates midterm years.
A two-observation sample provides very limited evidence. Establishing a reliable early-November edge would require the actual window returns, dispersion and success rate across the underlying years.
I use early November as a tactical window to watch. Price action, data and positioning have to support it; seasonality by itself cannot carry the trade thesis.
What would strengthen or weaken my view
I remain constructive on CAD into year-end because I see several possible sources of improvement: a resilient consumer, a firmer expected policy path, strategic investment interest and the potential for bearish positions to unwind.
The upcoming releases will show whether these possibilities are becoming more concrete:
- 6 November: the next labour report, testing my expectation of an employment rebound. 12
- 20 November: the full September retail report, testing the early indication of another spending increase. 10
- 30 November: the official Q3 GDP estimate and September monthly GDP release, testing the preliminary growth picture. 8
- Subsequent positioning reports and price action: whether gross-long recovery persists, shorts reduce exposure and support holds.
My view would weaken with repeated employment losses, deteriorating spending volumes, a sharper tariff-related slowdown, falling global commodity demand or a sustained loss of the marked price support.
I see more upside potential in CAD from here. The strongest confirmation would be improving Canadian data and higher prices alongside a reduction in bearish exposure.
Related currency analysis
Australian dollar: Why I see more downside risk
Sources
- 1. Bank of Canada: policy decision, 28 October 2026
- 2. Bank of Canada: energy-shock transmission channels, April 2026; mechanisms cited, not its superseded forecast
- 3. Natural Resources Canada: Ksi Lisims–SEFE agreement, 27 May 2026
- 4. European Commission: EU–Canada energy-security roundtable, 30 June 2026
- 5. European Council: Canada–EU summit, 29–30 October 2026, including energy cooperation and LNG feasibility study
- 6. Statistics Canada: Q2 2026 GDP, released 28 August
- 7. Bank of Canada: Tiff Macklem’s opening statement, 28 October 2026
- 8. Statistics Canada: August GDP and September advance estimate, released 30 October 2026
- 9. Statistics Canada: August merchandise trade, released 6 October 2026
- 10. Statistics Canada: August retail trade and September advance estimate, released 23 October 2026
- 11. Bank of Canada: Q3 Canadian Survey of Consumer Expectations, released 19 October 2026
- 12. Statistics Canada: September Labour Force Survey, released 9 October 2026
- 13. Statistics Canada: September CPI, released 19 October 2026
- 14. Bank of Canada: CPI and core-inflation table, September 2026 observation
- 15. CFTC: COT report categories, observation dates and release timing
- 16. CFTC: explanatory notes and non-reportable positions
Loading comments…