Why I’m Bullish on the British Pound Into Year-End
Horizon: Into year-end 2026

Economic research
Wages, renewed inflation pressure and the Bank of England’s next decisions are shaping my view. GBP/JPY is where I want to express it.
I remain bullish on the British pound through the end of 2026.
My view starts with monetary policy. For sterling, I pay particular attention to the expected Bank of England rate path, economic growth, confidence, wages and the services sector. Together, these help determine whether the currency can continue to attract support.
That combination is becoming more interesting to me. Wage growth may be finding a floor. Inflation is picking up again. The latest unemployment reading improved. Growth has also held up well enough to keep a restrictive policy stance on the table.
November gives this view several clear tests. Beyond the economic data, I also see a positioning structure and a seasonal window worth watching.
The trade I want to build around this is GBP/JPY. The macro view explains my direction. The chart determines my entry and how I protect the position.
The First Test Comes on 5 November
My base case is a 25-basis-point increase in Bank Rate, taking it from 3.75% to 4.00% next week.
The calendar below shows a projected 7–0–2 vote, with seven members expected to support a hike. This is the forecast for the upcoming meeting. At the last completed decision in September, three members voted to raise rates and six voted to hold. 1
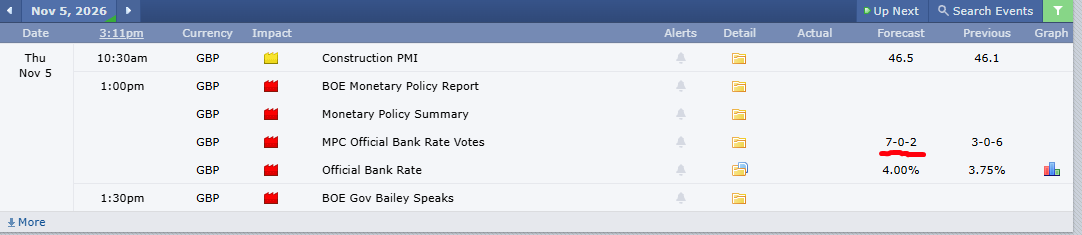
I favour the hike scenario because the inflation backdrop is becoming harder to ignore. The more important question for sterling is what the Bank signals about the meetings that follow.
A November increase is already widely anticipated. Reuters reported on 30 October that money markets had almost fully priced one in. Further gains in the pound therefore depend partly on how the outlook develops beyond that first move. 2
That is where wages and the labour market become important.
The Wage Slowdown May Be Finding a Floor
The wage chart is one of the reasons I am paying closer attention.
Regular earnings grew 3.7% year over year in June–August, according to the release published on 20 October. My dashboard shows that against a 3.6% forecast.
The longer chart still shows a substantial slowdown from earlier peaks, but the latest readings are attempting to turn higher. 3
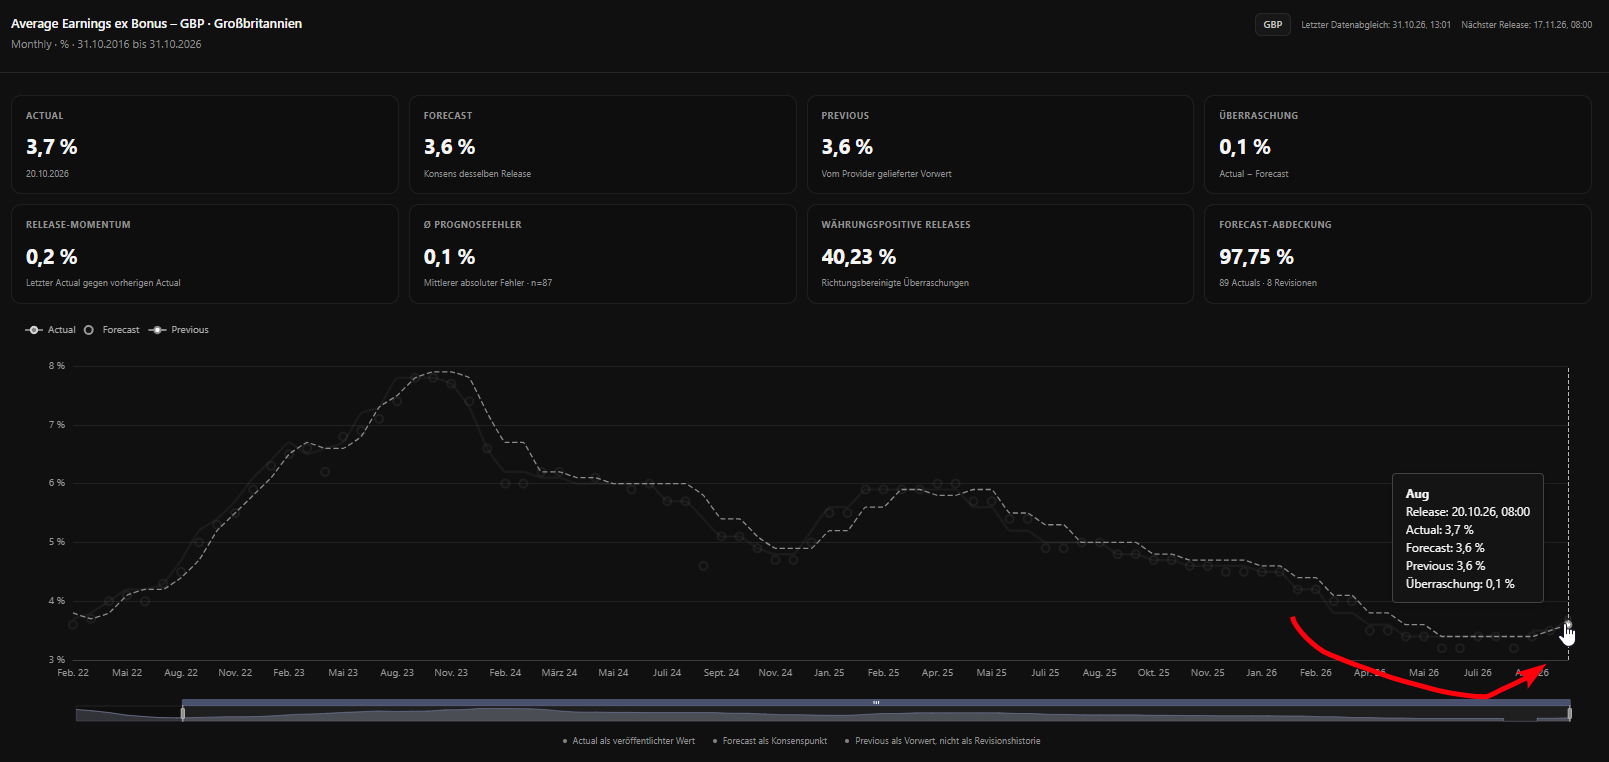
My interpretation is that wage disinflation may be losing momentum. I want to see whether that recent improvement develops into something more persistent.
There is a distinction inside the headline. Private-sector regular pay grew 3.0%, while public-sector growth was 6.3% and affected by the timing of pay awards. Real regular earnings rose only 0.6% after CPIH inflation, leaving households with a modest improvement in purchasing power. 3
The forward-looking evidence adds another piece.
The BoE’s October Decision Maker Panel puts expected wage growth over the next year at 3.4%, unchanged from the previous reading. Its business contacts report average 2026 pay settlements around 3.6%, with early indications for 2027 broadly similar. These are different measures, but together they make a rapid disappearance of wage pressure less convincing to me. 4 5
Wages matter because labour costs feed into the price of providing services. If pay growth remains firm while productivity cannot keep pace, businesses must absorb the pressure in margins, adjust staffing or raise prices.
For my GBP view, the question is whether wages settle at a level that keeps the BoE concerned about persistent inflation.
The Labour Market Is Part of the Same Story
The latest unemployment rate was 4.7% for June–August. My dashboard compares that with a 4.9% forecast, a downside surprise of 0.2 percentage points. 6
The chart also shows an improvement from the higher readings earlier in 2026.
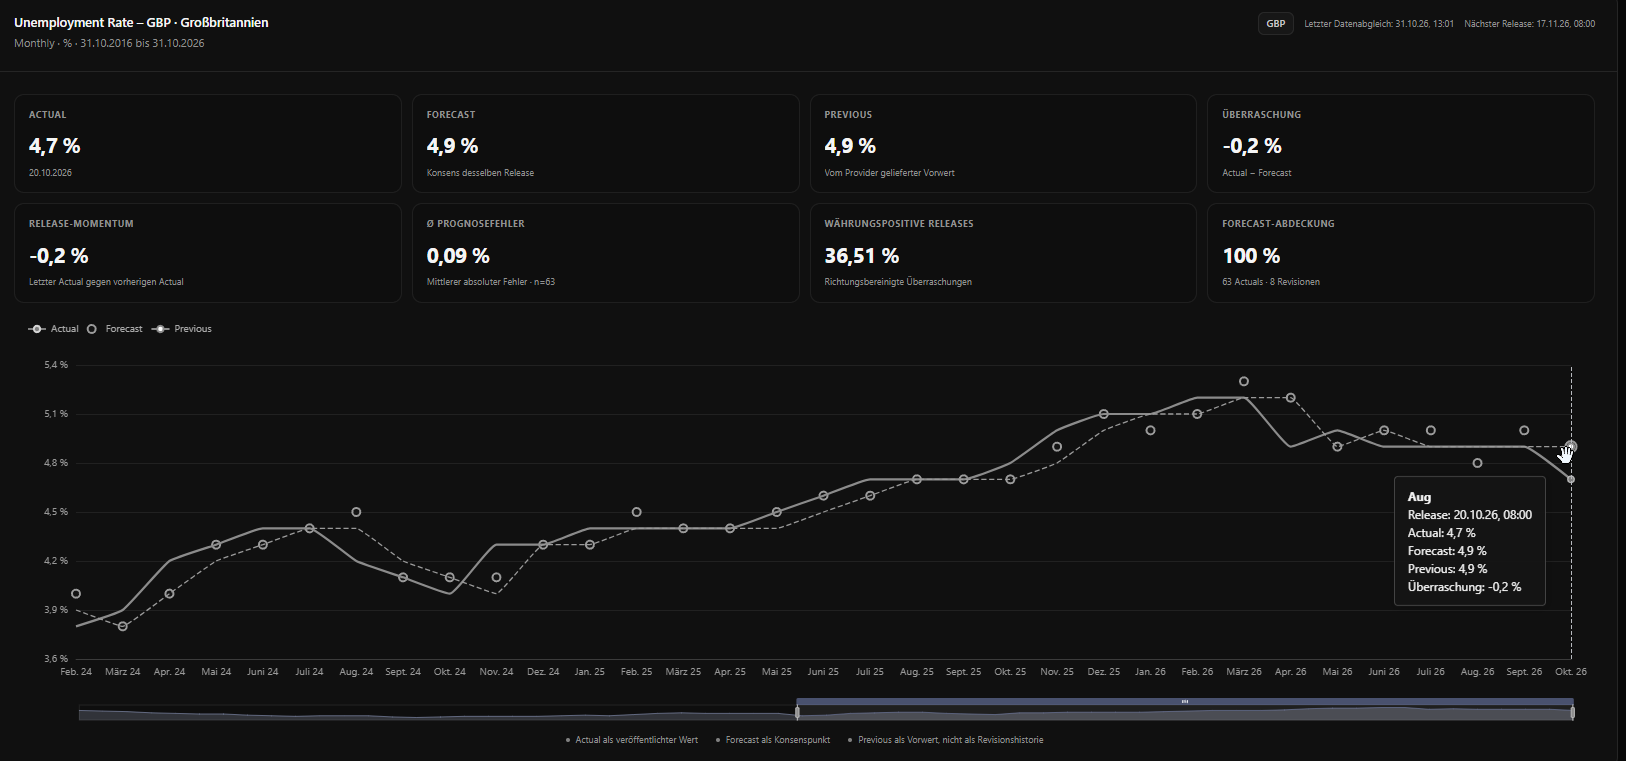
My expectation is that unemployment could move lower again. I am watching for confirmation on 17 November.
The combination I want to see is a labour market that holds up while inflation remains elevated. That would make it easier for the Bank to maintain a firm policy stance and consider further tightening if necessary.
The employment picture still has softer areas. Vacancies fell to 691,000 in July–September, down 21,000 from the previous quarter. A better unemployment reading therefore needs to be read alongside the broader evidence. 6
For now, the recent improvement keeps this part of my bullish scenario alive.
Inflation Is Moving Back Into Focus
September CPI inflation rose to 3.5%, from 3.1% in August. My dashboard shows a 3.4% forecast for the latest release.
Core inflation also rose, to 2.8%, while CPI services inflation increased to 3.7%. 7
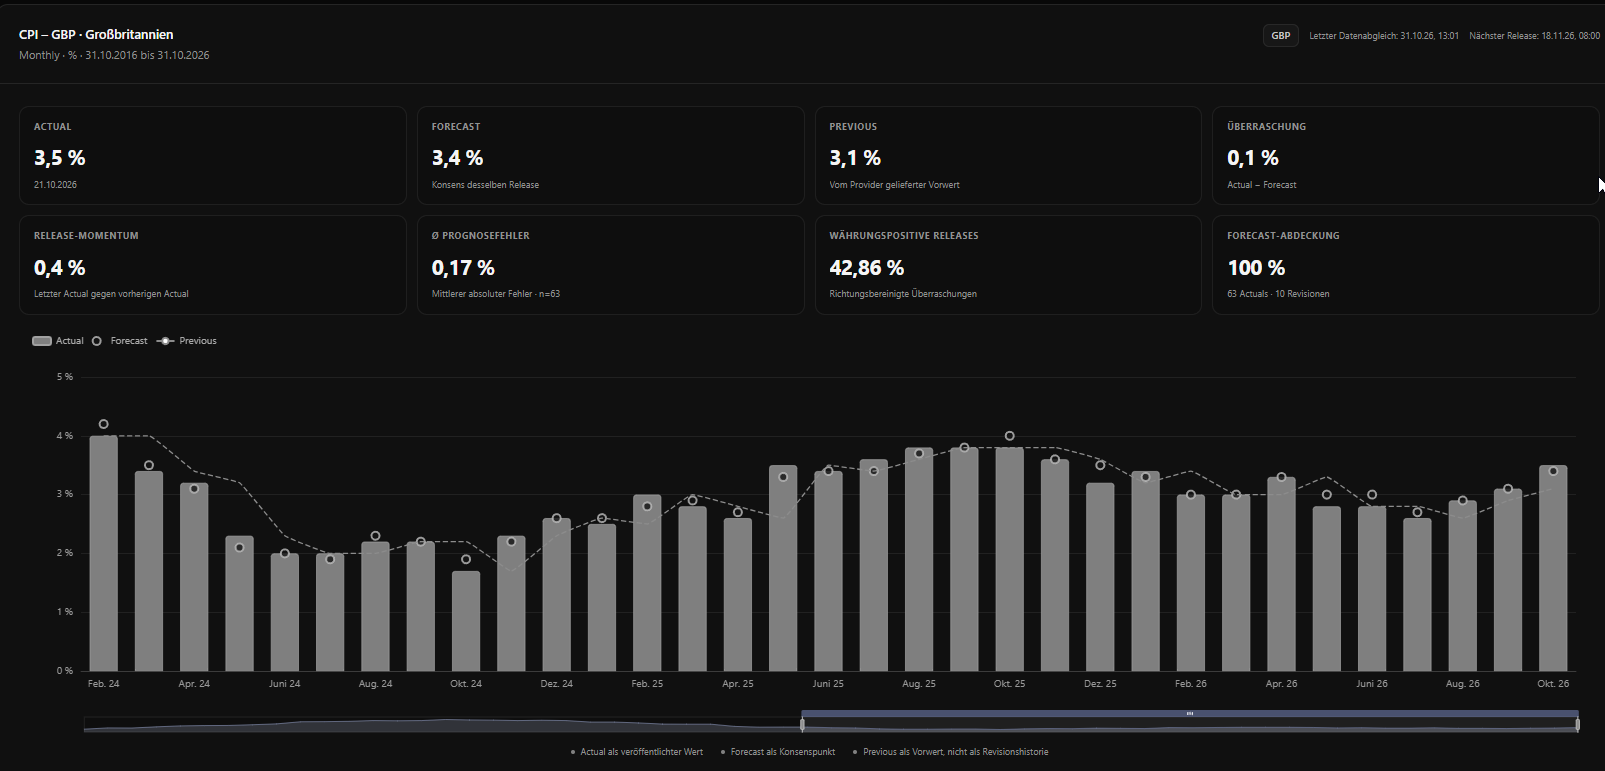
Given the oil and energy backdrop, I see a meaningful risk of another firm inflation reading in November. My expectation is that energy-related pressure will remain important as we move towards year-end.
The producer-price data reinforce that concern.
September factory-gate inflation reached 4.6% year over year, up from a revised 3.8%. Manufacturers’ input prices rose 8.3%. Oil and refined petroleum were major contributors to the renewed pressure. 8
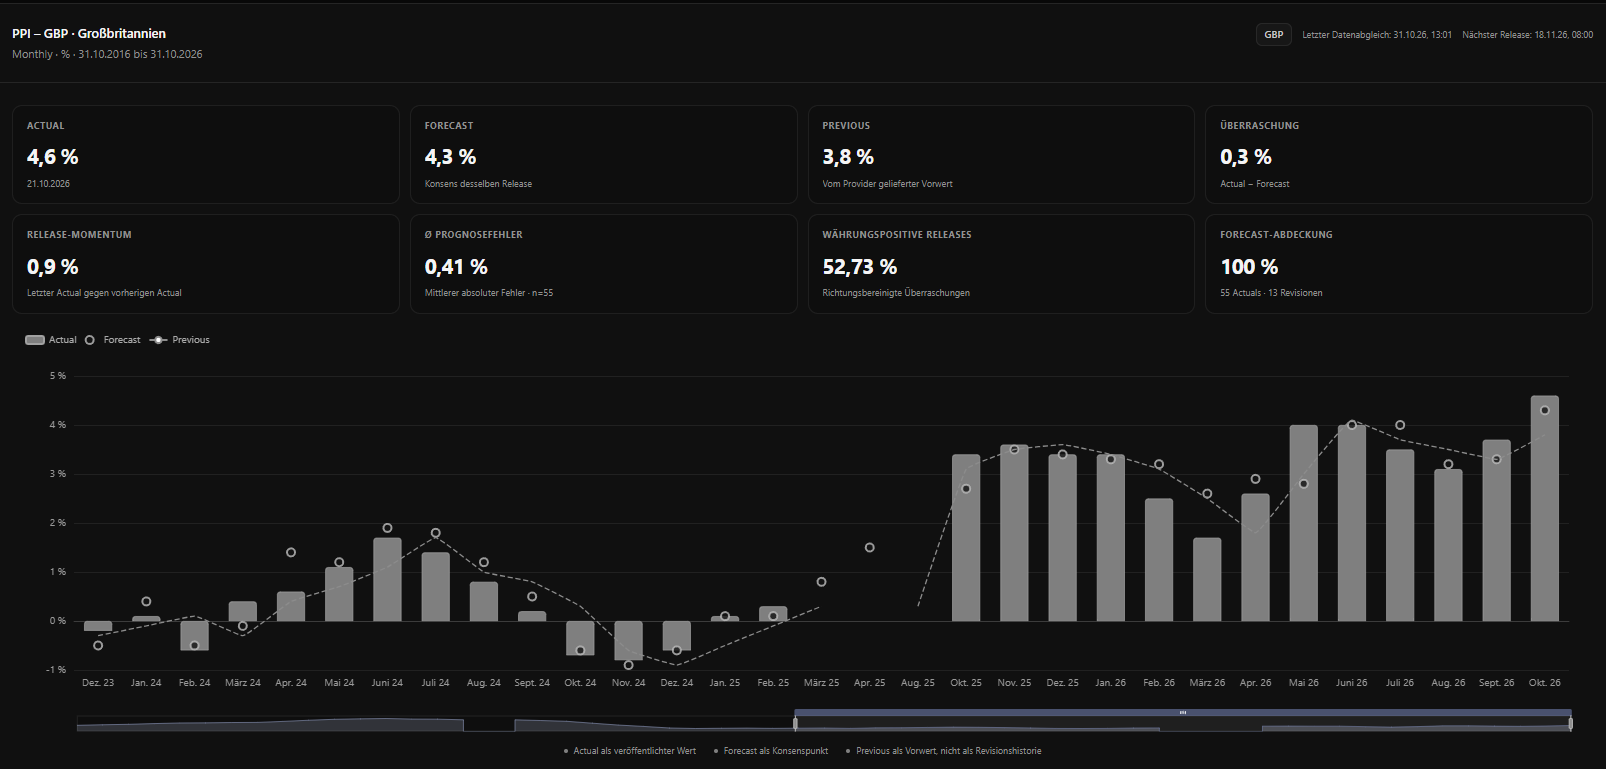
Producer prices do not pass into consumer prices one for one. Companies can absorb part of an increase, and weak demand can limit their pricing power. Even so, I see the direction of travel as relevant to the BoE’s next decisions.
My bullish scenario is strongest if firmer prices arrive alongside a reasonably resilient labour market.
If the energy shock mainly damages household spending and employment, the implications for sterling become much less supportive.
Growth Gives the Bank More Room
The growth backdrop also matters to me.
Real GDP expanded 0.7% in the three months to August compared with the previous three months. Services grew 0.9% over the same period. The monthly August increase was more modest at 0.1%, and construction remained weak. 9
I read that as an economy still capable of giving the Bank some room to address inflation.
It also makes the services side especially important. I want activity and employment to remain resilient while price pressure keeps the BoE attentive.
Confidence matters here too. Higher interest rates support my currency view only while investors believe the policy mix is credible and the economy can carry it.
Why the Other Side of the Pair Matters
Being bullish on sterling does not mean I expect every GBP pair to behave in the same way.
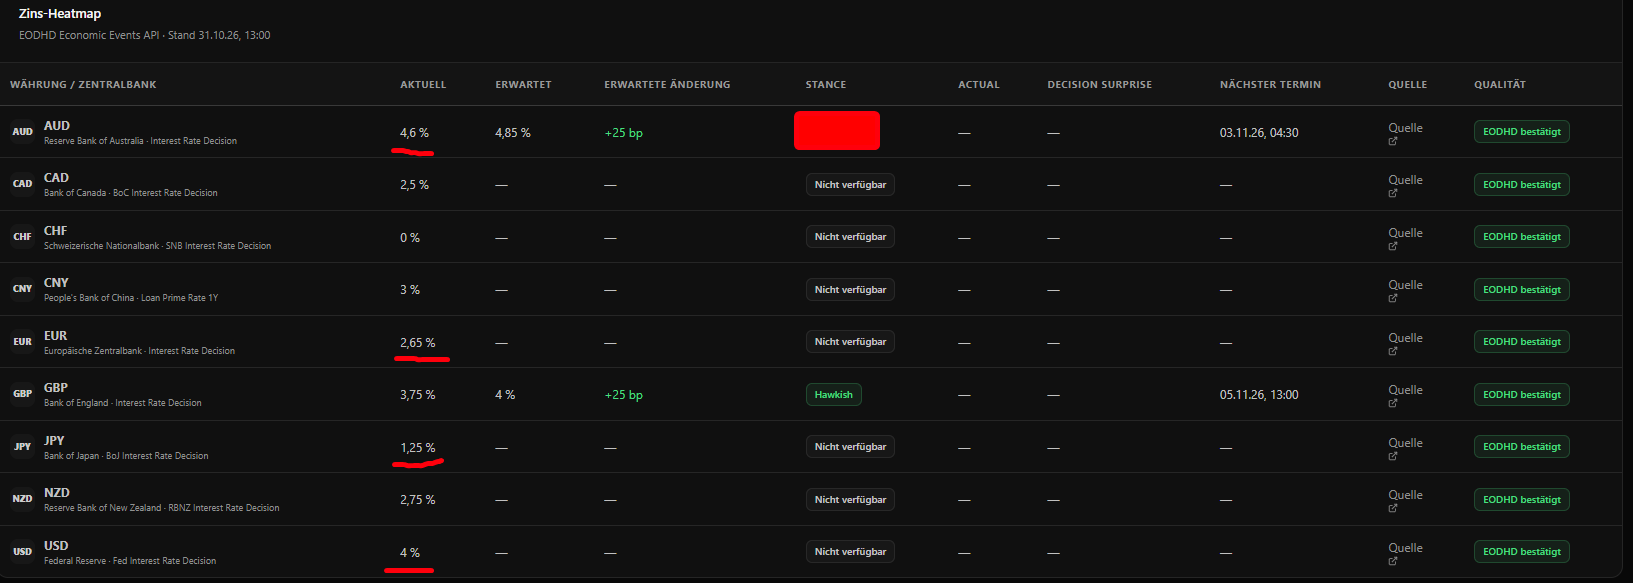
The interest-rate heatmap helps frame the differences.
GBP/JPY: The Clearest Current Rate Advantage
The UK’s 3.75% Bank Rate compares with a Japanese policy rate around 1.25%.
That is a nominal policy-rate gap of 2.50 percentage points. If the BoE moves to 4.00% while Japan remains unchanged, it widens to 2.75 points. 1 12
That is a direct reason for my interest in GBP/JPY.
The actual carry depends on the instrument and financing terms, while the exchange rate still depends on expectations and market conditions. But the current policy-rate difference gives this pair a clear foundation for my thesis.
GBP/AUD: My View Depends on the Next Shift
Australia is more complicated.
The RBA’s cash rate is already 4.60%, and my heatmap shows 4.85% as the next expected level. Australia currently offers the higher policy rate. If both central banks deliver the forecast 25-basis-point increases, that gap remains unchanged. 13
My constructive view on GBP/AUD rests on what I think happens afterwards.
I expect the pressure on Australian households, housing and domestic demand to make continued tightening increasingly difficult. The RBA itself acknowledges slowing growth and weaker housing conditions, although it still says further increases may be necessary. 13
If that pressure eventually changes the Australian policy outlook while UK wage and inflation developments keep the BoE firm, I think sterling could benefit from the relative repricing.
That remains my expectation for the next phase. The RBA has yet to signal such a change.
GBP Against the Dollar and Euro
Against the dollar, I see the Fed’s latest hold as potentially helpful in the near term if the BoE hikes.
But the Fed’s target remains 3.75–4.00%, so a UK move to 4.00% would only bring Bank Rate to the top of that range. 11
Against the euro, the UK already has a rate advantage over the ECB’s 2.50% deposit rate. 10
I am more cautious about extending either argument too far into the future. The relative policy paths can change, and a favourable November decision can already be reflected in price.
My clearest trade preference remains GBP/JPY.
November Brings the Data and Timing Together
The seasonal chart gives me a window to watch around the economic calendar:
- 5 November: Bank of England decision and Monetary Policy Report.
- 17 November: wages, unemployment and the wider labour market.
- 18 November: CPI and producer prices.
Those releases sit inside the area I have marked on the chart. 1 3 7 8
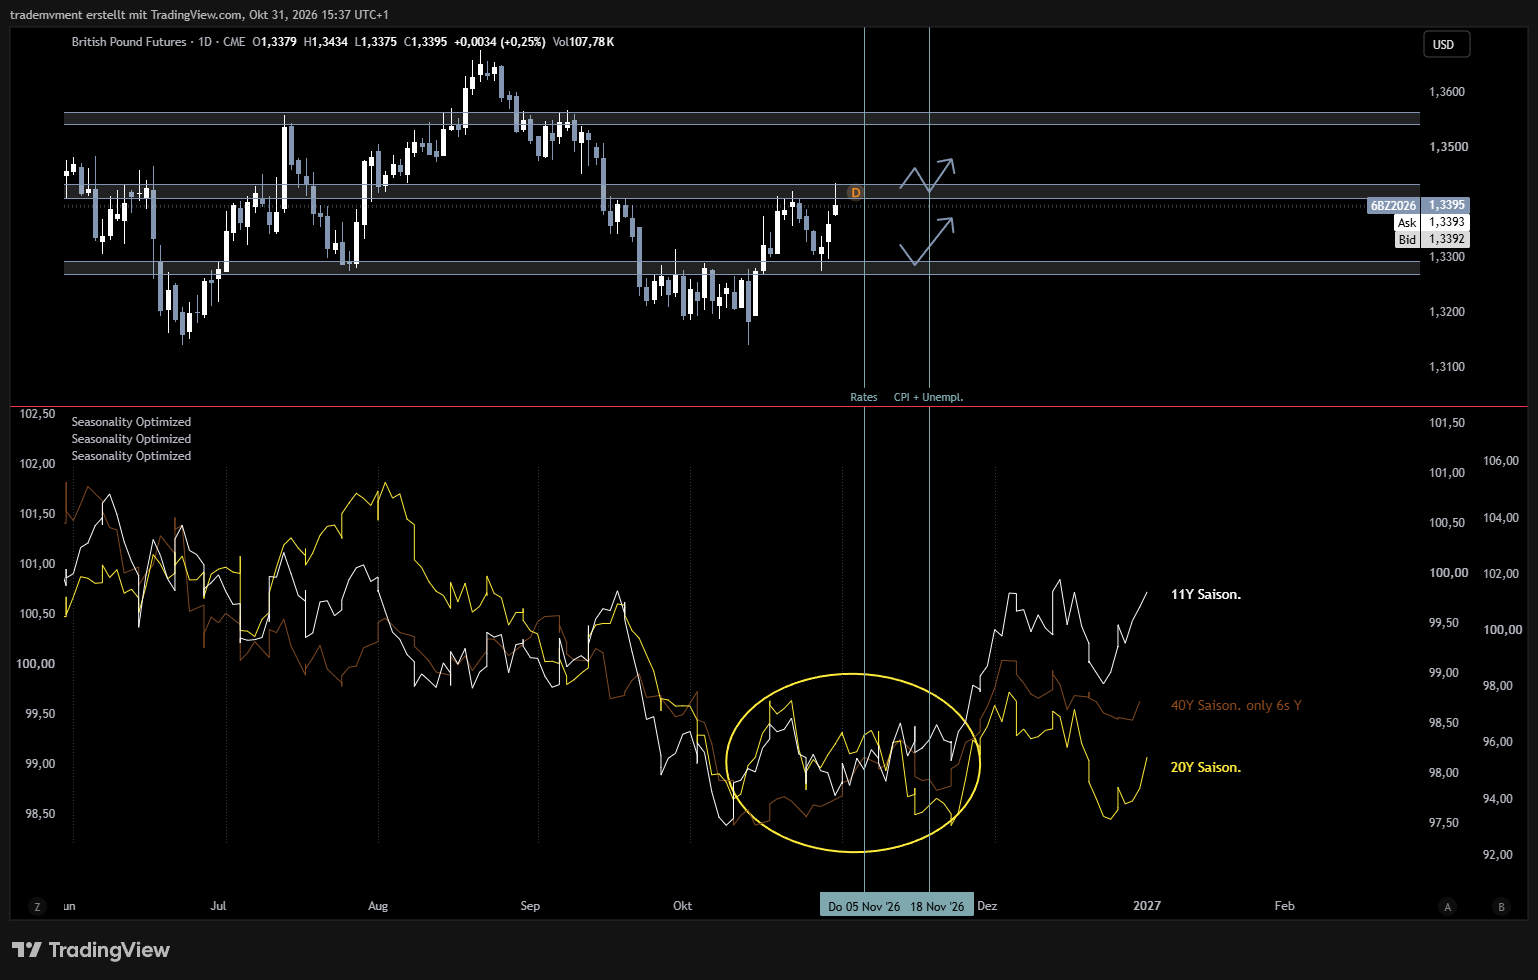
The 11-year seasonal line is more constructive into December. The 20-year history is less consistent, and the filtered 40-year series gives a more restrained picture.
I use these curves to identify a possible transition window. Their different samples and scales make timing more useful to me than a direct comparison of their apparent size.
If the BoE hikes, unemployment improves and inflation remains firm, those events could reinforce one another during this window.
That is the sequence I am watching. The data and price action still need to deliver it.
Positioning Has Moved More Than Price
The COT chart is one of the most interesting parts of the setup.
The consolidation highlighted on my chart spans approximately 565 calendar days. Within that extended range, commercial positioning has become much more constructive over time, while large non-commercial traders remain net short.
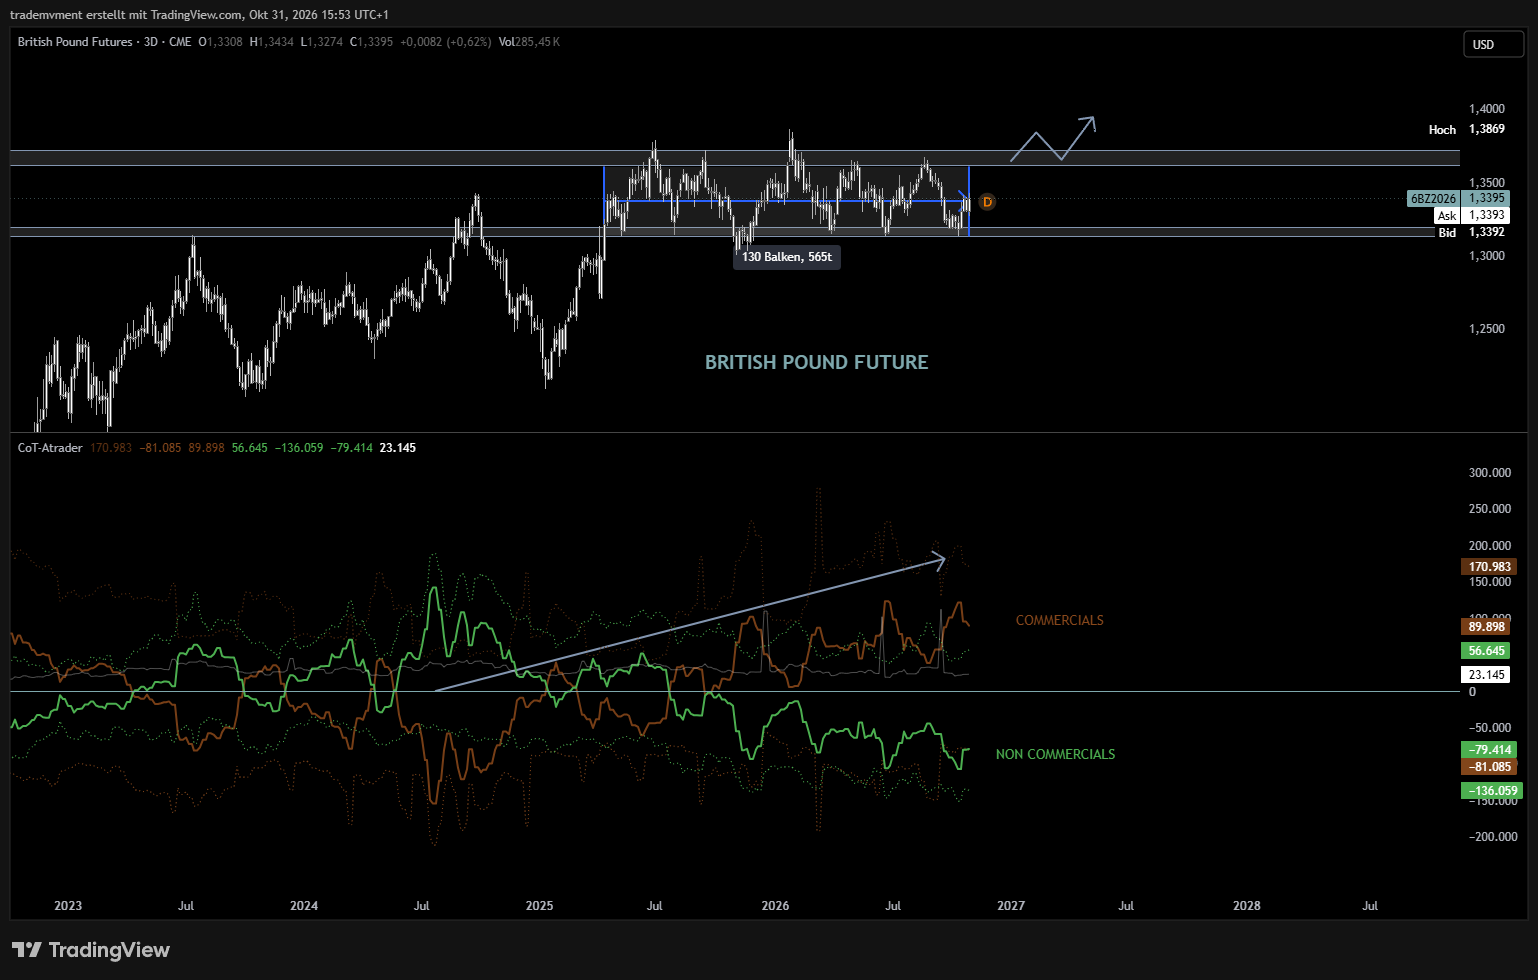
The CFTC futures-only report for 27 October shows net positions of approximately:
- Commercials: +89,898 contracts.
- Non-commercials: −79,414 contracts.
- Non-reportables: −10,484 contracts.
Non-reportable shorts fell by 4,393 contracts in the latest week. That is an early reduction in bearish exposure, although it does not establish a lasting bottom.
Commercial net longs also declined that week, so the longer-term buildup has not been a straight line. 14
The categories matter. Commercial positioning often reflects hedging. Non-commercials are a separate speculative category, and non-reportables cannot be treated as a complete measure of retail FX sentiment. 15
What interests me is the possible buying that could follow if sterling strengthens and short positions have to be reduced.
A convincing breakout, supported by the policy outlook, could make that adjustment more forceful.
I am watching for short covering to reinforce a move that price has begun to confirm.
The futures data inform the sterling side of my view. The yen still needs its own assessment.
Price Still Has to Confirm the Thesis
My daily GBP futures chart shows two paths I am prepared to consider.
The first is a break and successful retest of the nearby resistance area around 1.341–1.343.
The second is a deeper pullback towards 1.327–1.329, followed by another attempt higher.
The next upper area marked on the chart is approximately 1.354–1.356.
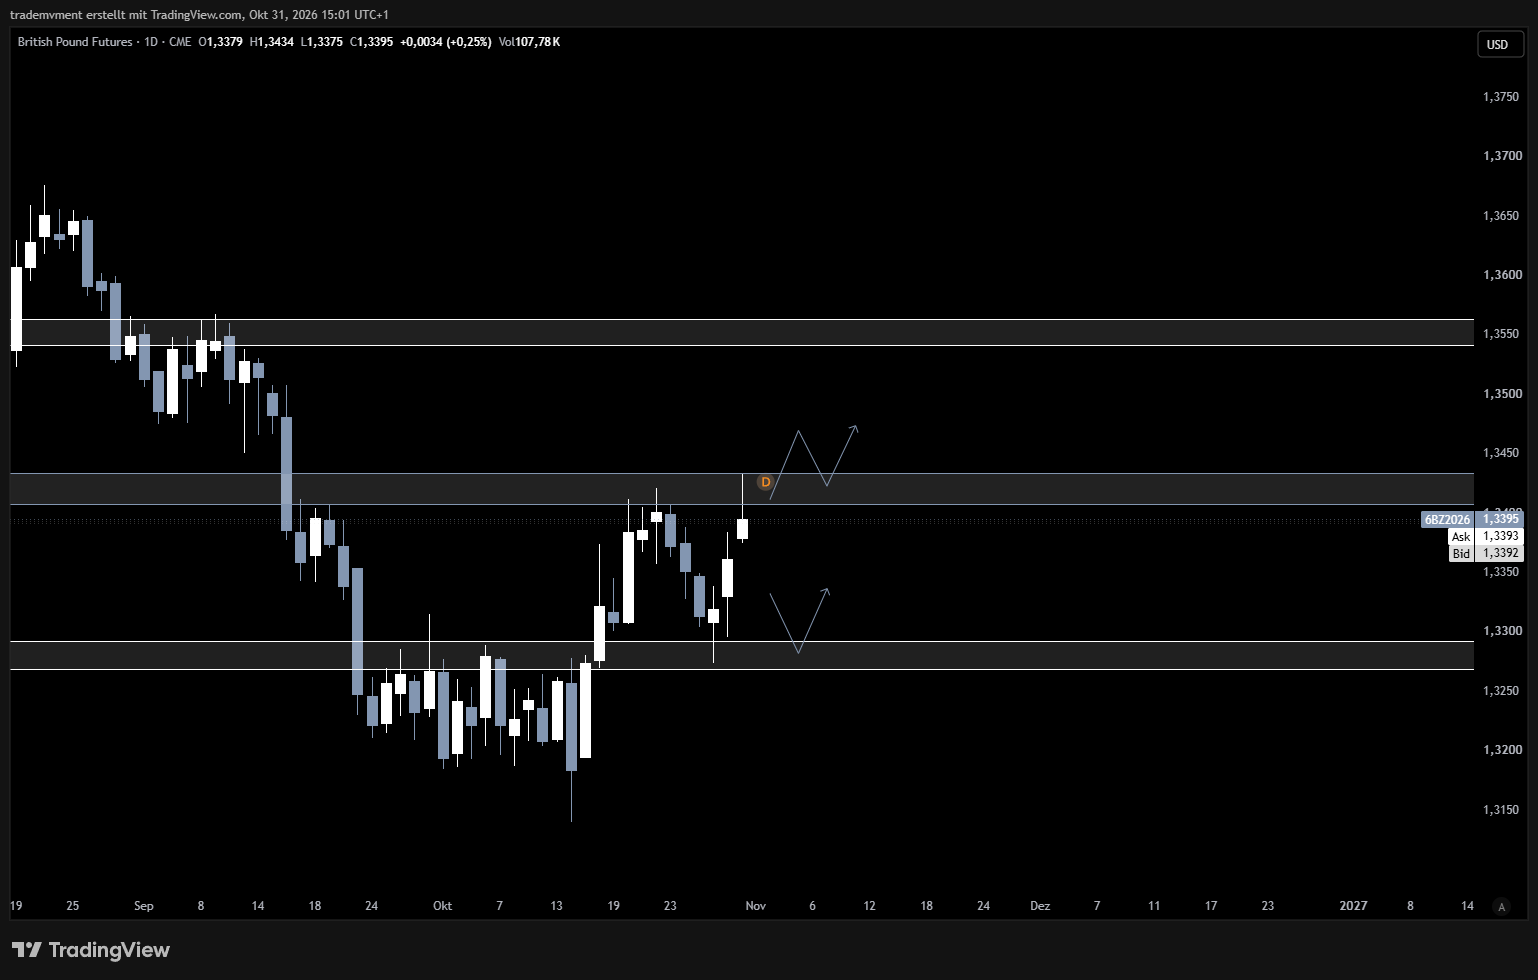
Both scenarios allow for a constructive outcome, but they require different patience.
The macro thesis gives me a reason to watch. I still want the market to show how it intends to move through these areas.
The GBP/JPY Behaviour I Want to Trade
The rate differential is the main reason I want to express this view through GBP/JPY. The price behaviour is another reason I find it interesting.
In the examples below, recoveries often develop through slow, overlapping advances interrupted by sharp pullbacks. Those pullbacks can revisit areas where a lot of trading previously took place.
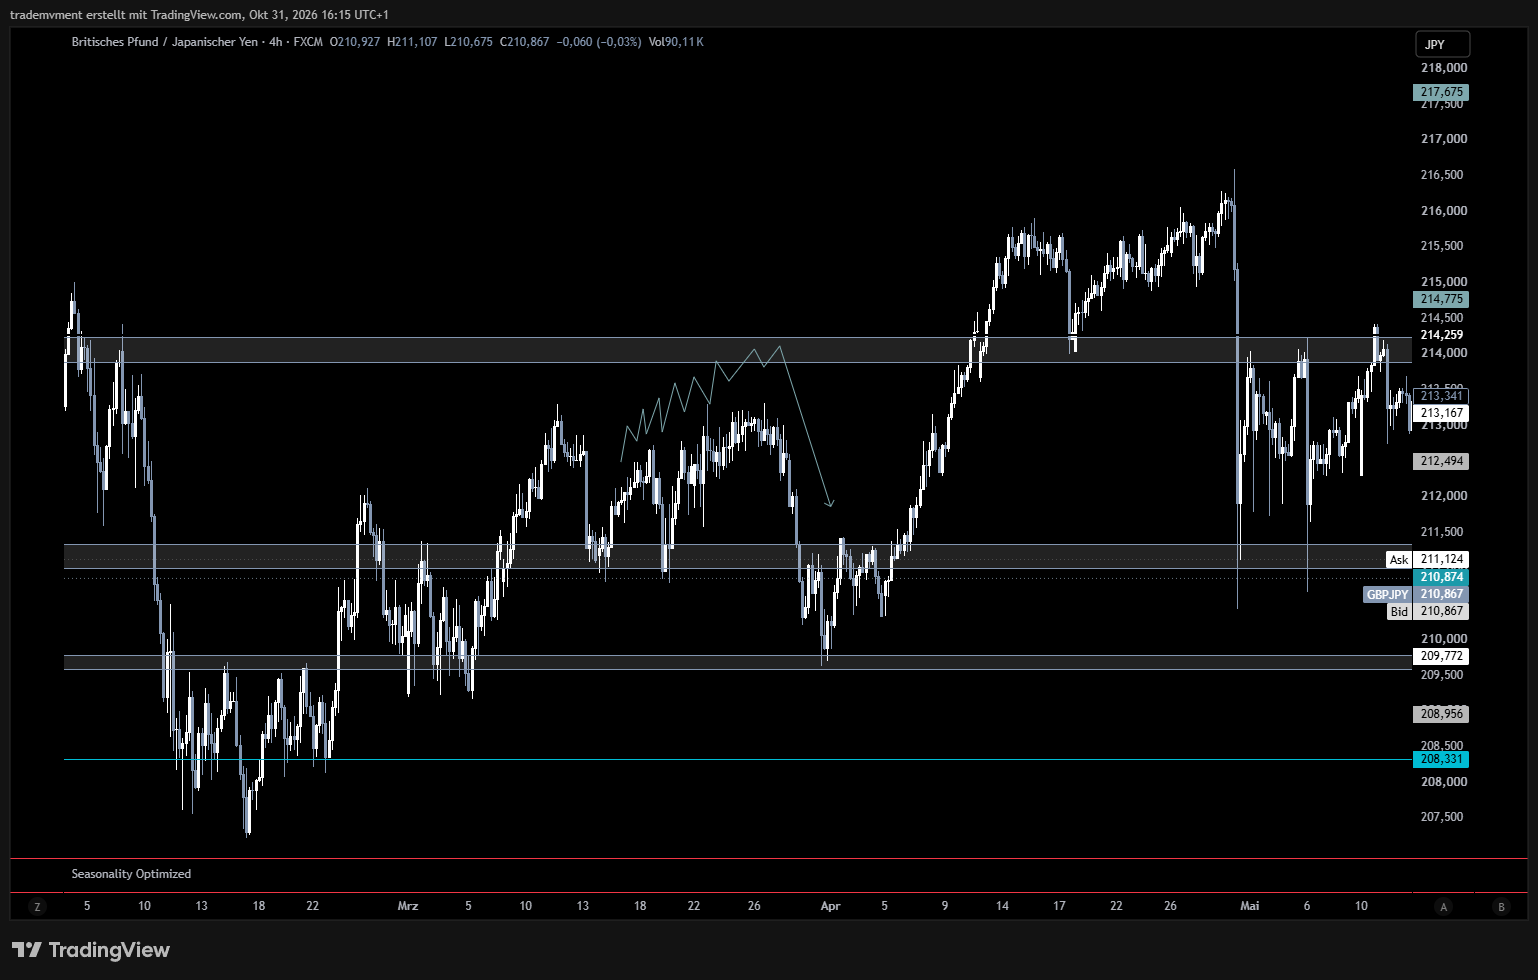
I want to use that behaviour to improve my entry location.
A retracement towards the lower edge of the value area can offer a more defined setup than entering near the recent highs.
The next historical example also shows the difficulty. Price revisited the lower area and swept below the illustrated stop before the larger advance developed.
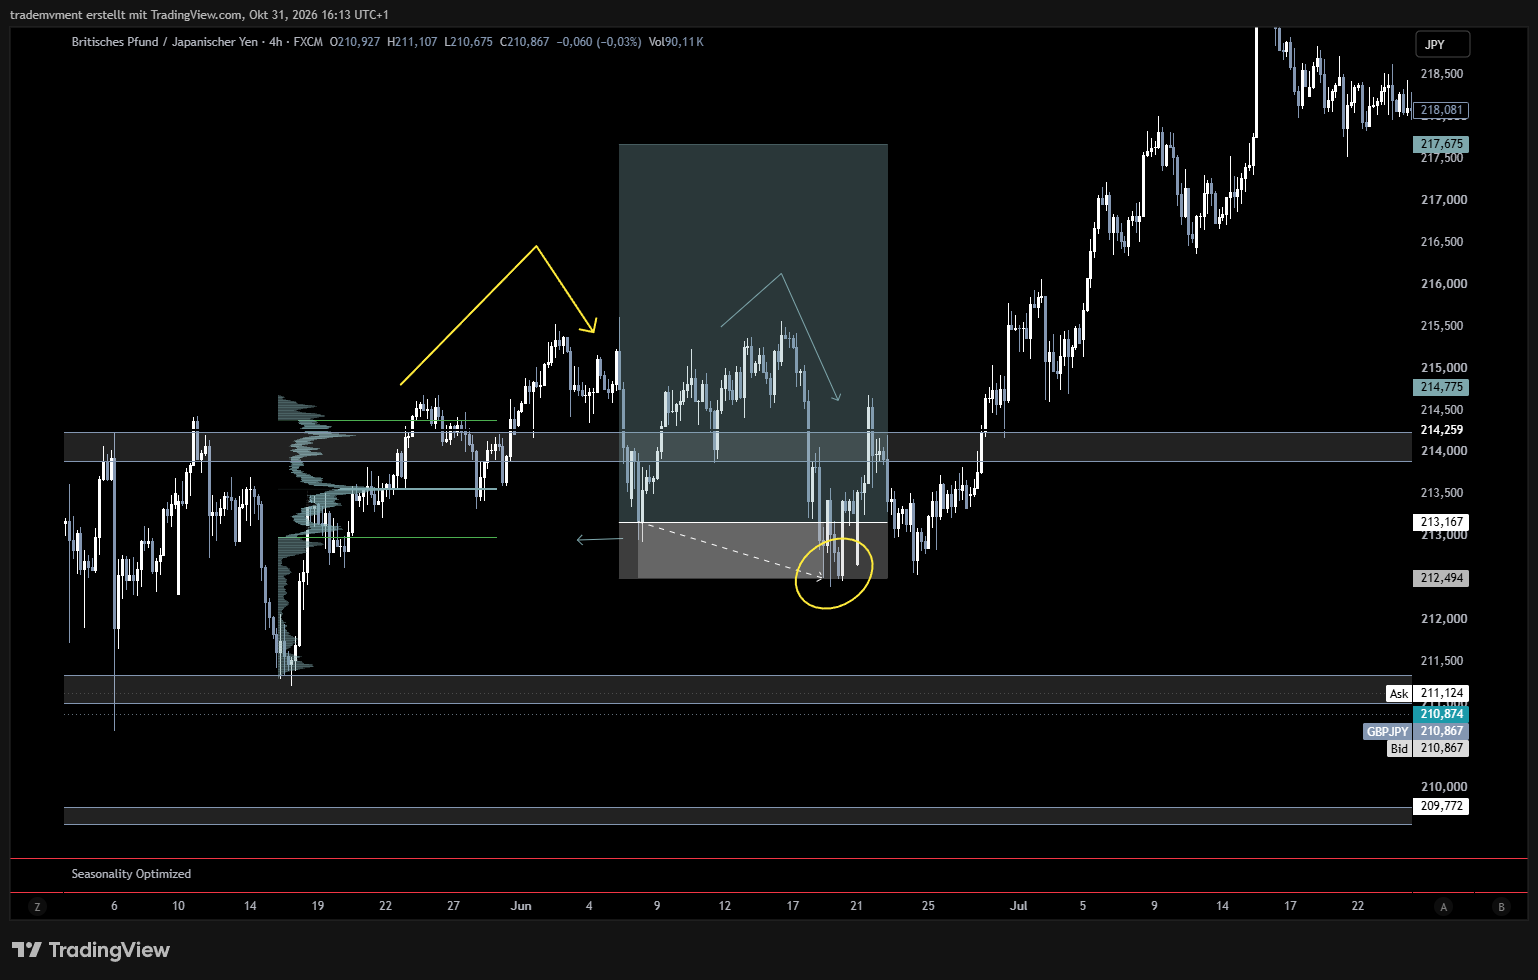
That is why I care about both the location and the possibility that the first attempt fails.
A later rally would not undo an earlier stop-out.
My Current GBP/JPY Plan
My planned entry is around the Value Area Low marked on my chart, below the recent highs.
The levels shown are:
- Entry: 209.772.
- Initial stop: 208.956.
- Upside objective: 214.775.
That gives approximately 81.6 pips of initial risk against 500.3 pips of potential reward, or roughly 6.1R before trading costs.
This describes the planned setup, with the entry below the price shown in the screenshot.
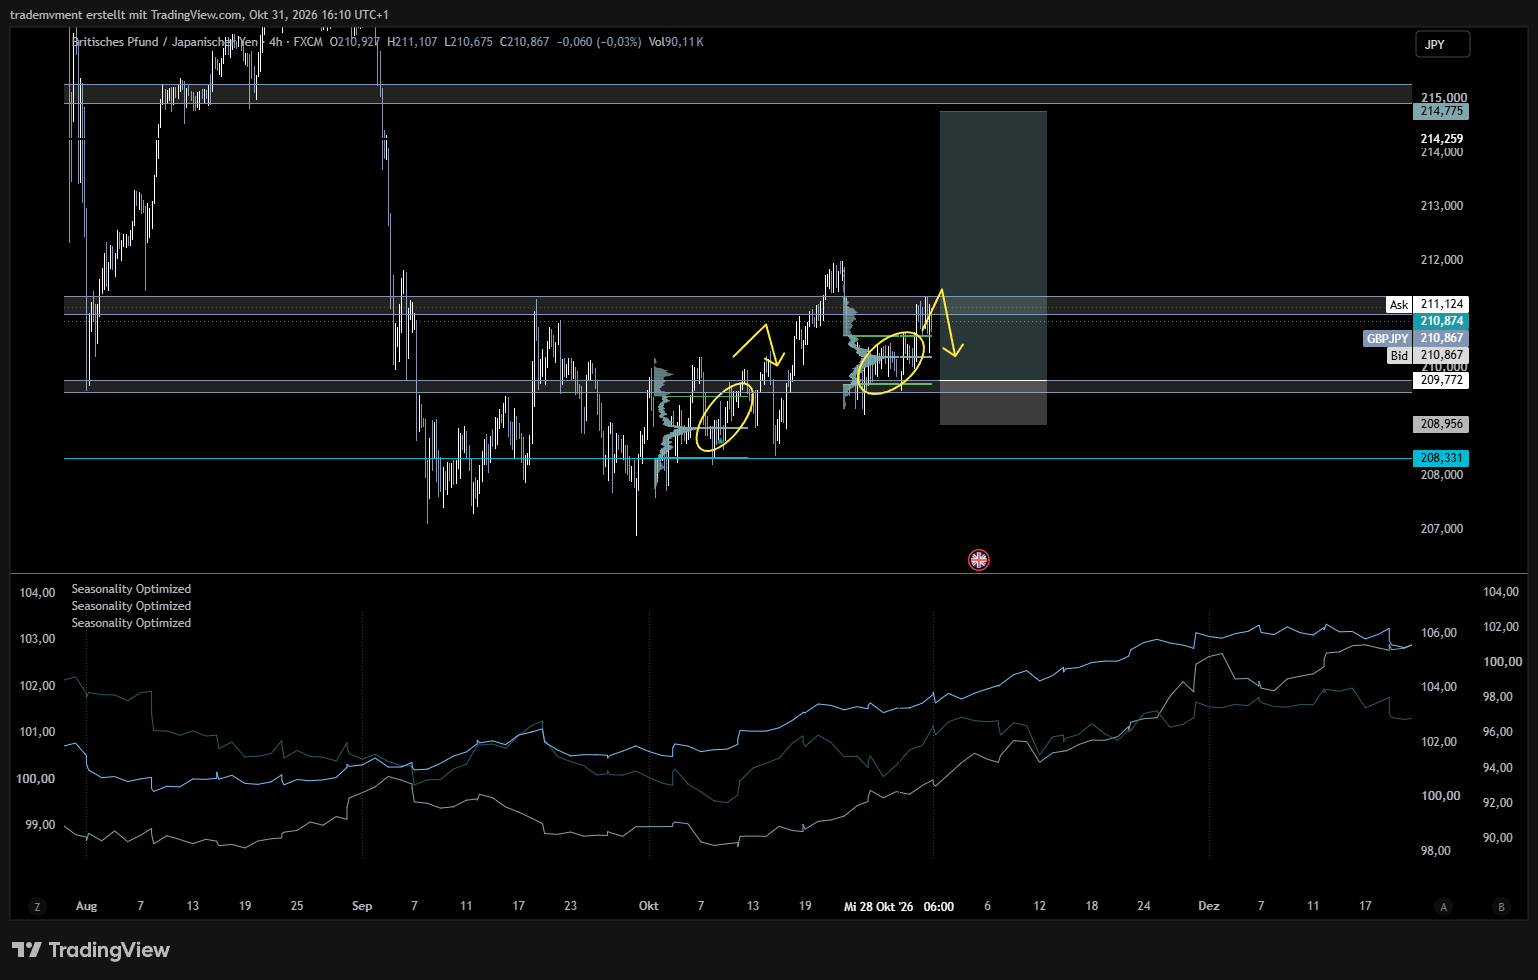
If price breaks the swing highs marked on this setup, my plan is to move the stop to the entry level.
From there, I want to trail the position as the structure develops.
That is my management plan for a filled trade. The eventual result will still depend on execution, costs and how the market moves.
Why I Want to Protect the Advance
The final historical chart explains why I want an active exit plan.
GBP/JPY built an advance over time, then gave much of it back quickly. The illustrated upper target was not reached during that first rise.
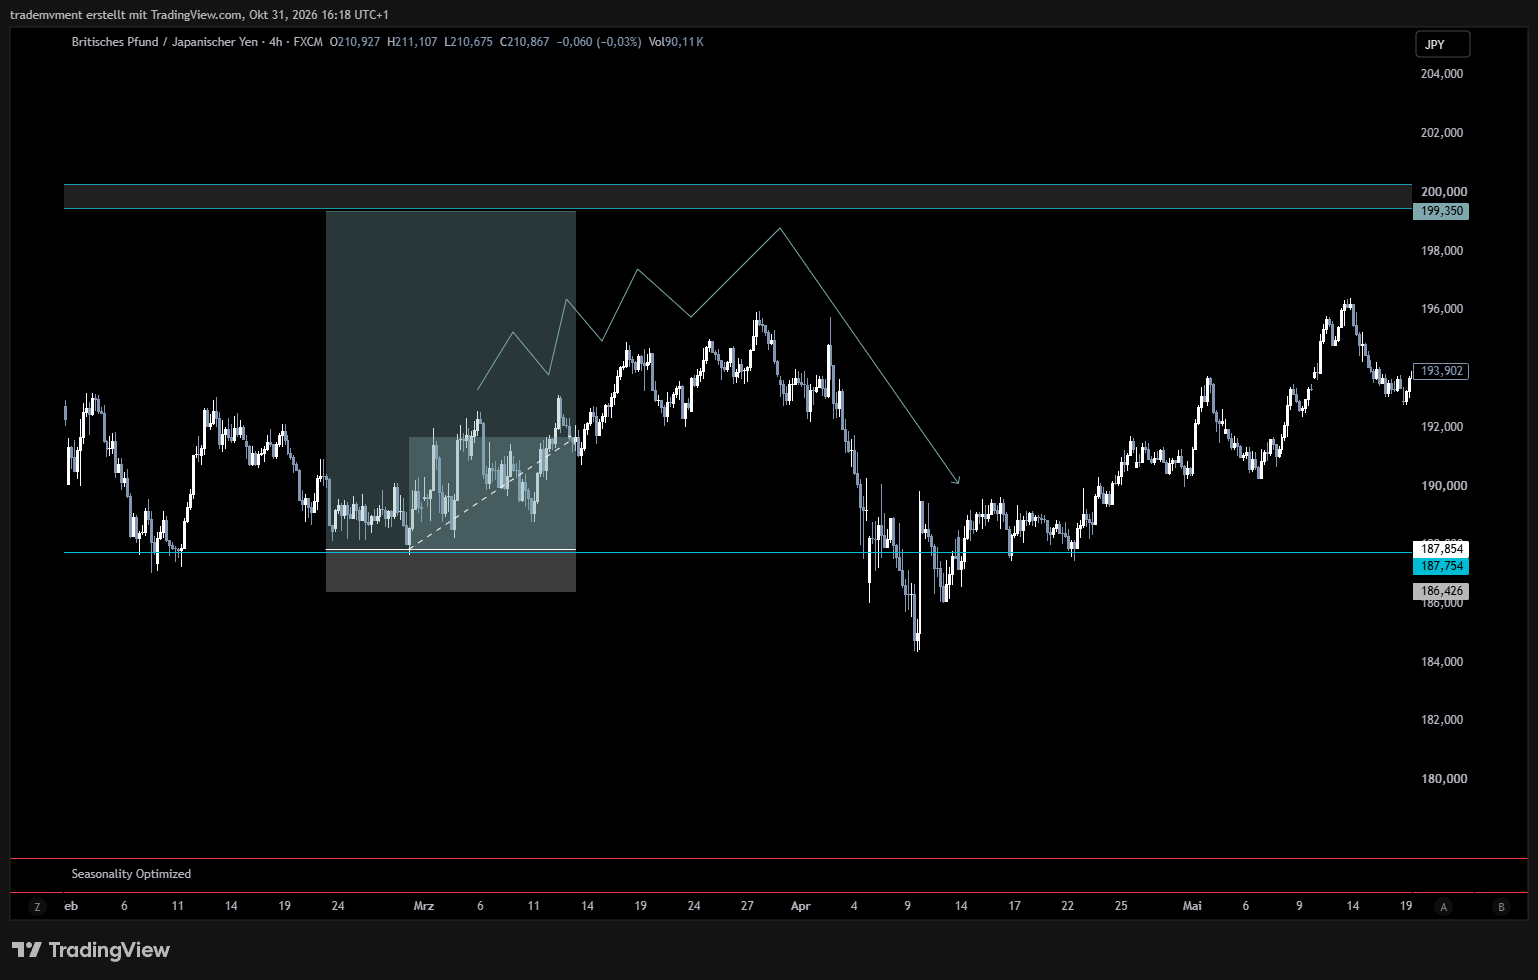
A shift in policy expectations, a stronger yen or a sudden change in risk appetite could undermine the setup. I want to give a confirmed move room to develop while adjusting protection as it progresses.
My bullish bias is focused on the remainder of 2026. I am leaving the new-year outlook open.
For now, I want the November decisions, wages, inflation and price action to keep supporting the same direction. A softer policy outlook, a clear deterioration in employment or a failure of the chart structure would make me reassess.
I have a view, a window and a defined entry plan. The next step belongs to the data and the market.
Sources
- 1. Bank of England: September 2026 monetary policy decision and minutes.
- 2. Reuters: Pound stands tall as dollar, euro wilt, 30 October 2026.
- 3. ONS: Average weekly earnings, October 2026.
- 4. Bank of England: October 2026 Decision Maker Panel.
- 5. Bank of England: Agents’ summary of business conditions, October 2026.
- 6. ONS: Labour market overview, October 2026.
- 7. ONS: Consumer price inflation, September 2026.
- 8. ONS: Producer price inflation, September 2026.
- 9. ONS: GDP monthly estimate, August 2026.
- 10. European Central Bank: Monetary policy decisions, 29 October 2026.
- 11. Federal Reserve: FOMC statement, 28 October 2026.
- 12. Bank of Japan: Statement on Monetary Policy, 30 October 2026.
- 13. Reserve Bank of Australia: Monetary Policy Decision, 29 September 2026.
- 14. CFTC: CME Legacy Futures Only report, positions as of 27 October 2026.
- 15. CFTC: Commitments of Traders explanatory notes.
Original publication
Loading comments…